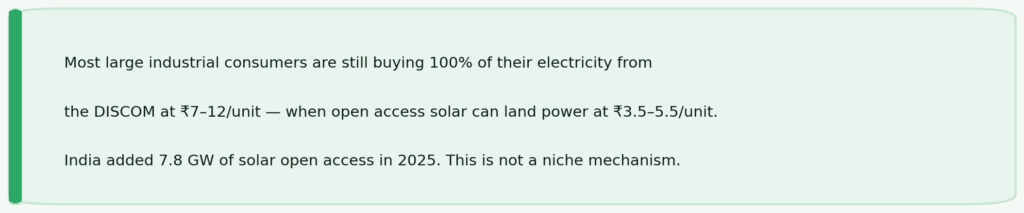
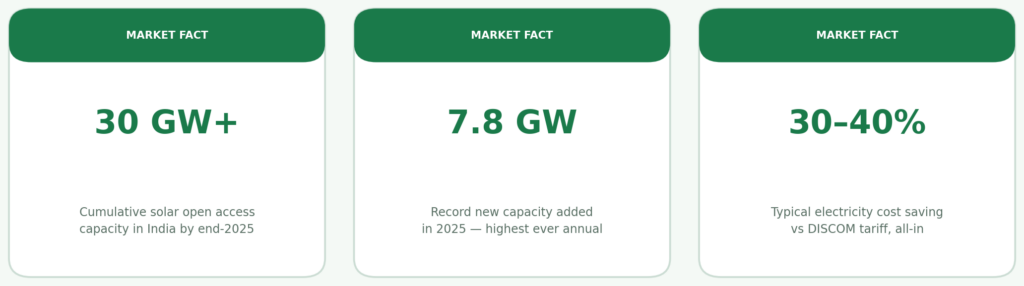
Most large industrial and commercial consumers in India are still buying 100% of their electricity from the DISCOM — paying ₹7–12 per unit — when a structurally cheaper alternative has been scaling for years. Open access solar in India lets qualifying businesses source electricity from a solar plant wheeled through the state grid, landed at their facility at ₹3.5–5.5 per unit all-in. India added a record 7.8 GW of solar open access capacity in 2025, crossing 30 GW cumulative — and the pipeline entering 2026 stands at 45+ GW. This is not a niche mechanism. It’s the mainstream route to large-scale clean energy procurement for C&I buyers in India.
What Is Open Access Solar in India?
Open access solar is a legal mechanism under the Electricity Act, 2003, that allows large electricity consumers to source power from a generator of their choice — rather than purchasing exclusively from their DISCOM — by using the existing transmission and distribution infrastructure of the grid.
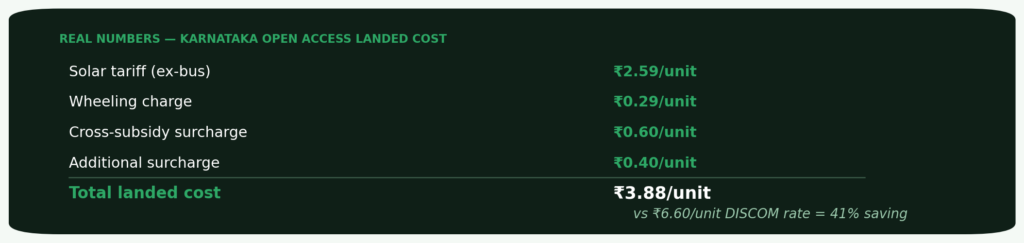
The financial case is built on the spread between what you pay the DISCOM and what you pay for open access solar all-in. In Karnataka, a typical landed cost calculation looks like: ₹2.59/unit solar tariff + ₹0.29 wheeling + ₹0.60 CSS + ₹0.40 additional surcharge = ₹3.88/unit — a 41% reduction against the prevailing BESCOM HT-2(a) industrial tariff of ₹6.60/unit. That 41% is recurring, locked in for the duration of your PPA, and grows in real value every year as DISCOM tariffs continue to rise at 5–8% annually.
Who Is Eligible for Open Access Solar in India?
The first eligibility threshold is contract demand: typically a minimum of 100 kW for renewable open access, though thresholds vary by state. For most meaningful industrial and commercial consumers — those spending ₹15 lakh per month or more on electricity — open access is not just eligible but increasingly essential.
Key eligibility factors: contract demand of 100 kW minimum (500 kW in some states), high-tension connection, and location in a state with supportive open access policy. SafEarth’s open access solar guide covers state-specific eligibility in detail. Companies with multiple facilities can structure a portfolio of open access contracts — though each state’s regulations govern each facility independently.
How Does Open Access Solar Actually Work?
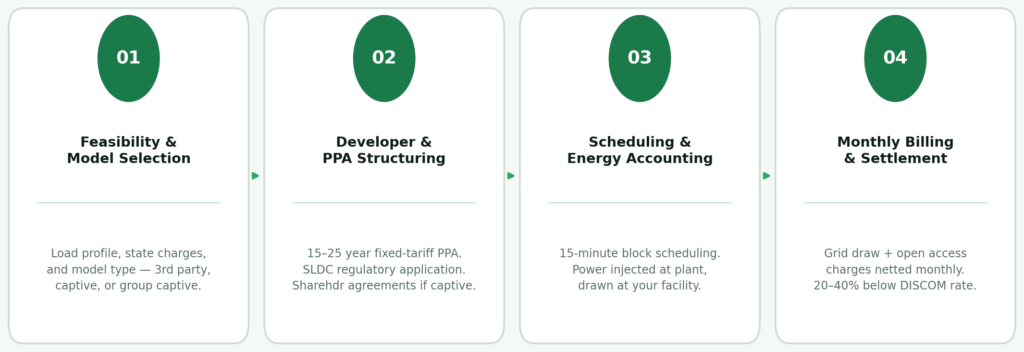
The open access solar process begins with a feasibility assessment — load profile analysis, state-specific charge modelling, and model selection. SafEarth delivers this as part of its 48-hour DPR process. Regulatory applications are then submitted to the SLDC, PPA agreements are finalised, and once commissioned, 15-minute block scheduling coordinates power injection at the plant and draw at your facility. Monthly settlement reflects the combination of grid draw and applicable open access charges.
Understanding Open Access Solar Charges
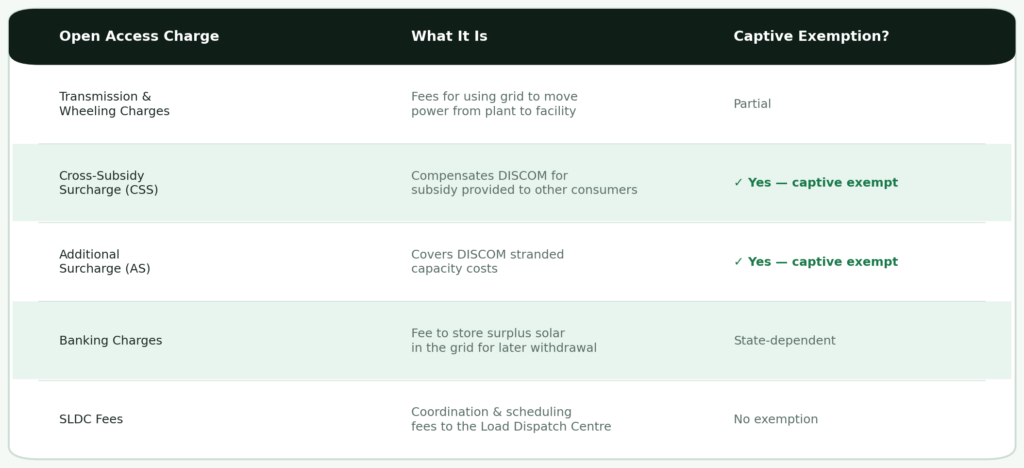
Transmission and Wheeling Charges cover grid usage. Karnataka’s wheeling charges are among the lowest at ₹0.29/unit; other states range significantly higher. Cross-Subsidy Surcharge (CSS) is the most significant variable — in third-party open access it applies in full; in captive and group captive structures, CSS and Additional Surcharge exemptions under the Electricity Act 2003 make landed costs substantially lower. Banking charges apply when storing surplus solar in the grid for later use. Maharashtra’s banking charge was revised to 8%, significantly impacting open access economics for daytime surplus generators.
Open Access Solar Models: Third-Party, Captive, and Group Captive
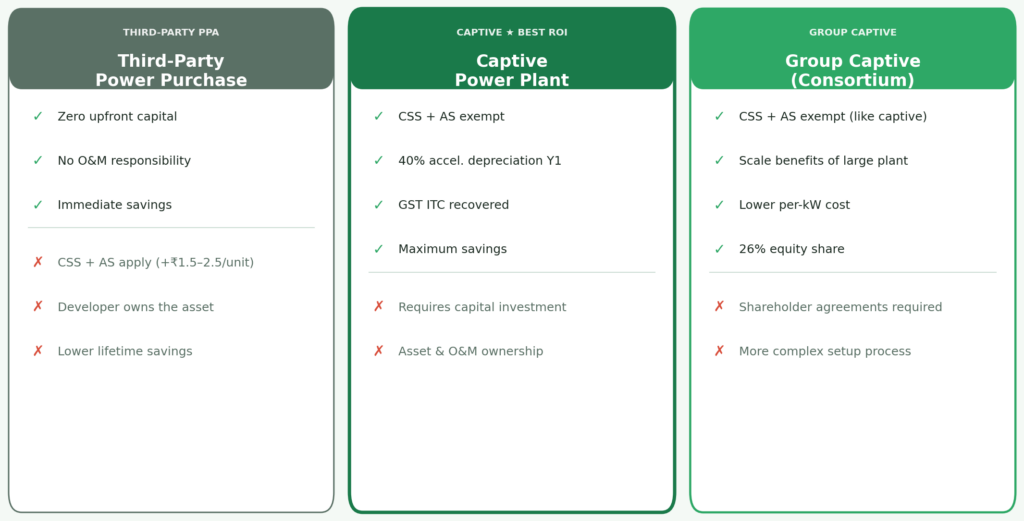
Third-party PPA: Zero capital, immediate savings, but CSS and Additional Surcharge apply — adding ₹1.5–2.5/unit to landed cost. Best in states where these charges are low, or where DISCOM tariffs are high enough to absorb them. Captive power plant: You own the solar plant, attract 40% accelerated depreciation in Year 1 and full CSS exemption. Maximum savings, requires capital. Group captive: A consortium holds 26% equity in a shared plant, consumes 51% of output, and receives full captive status — CSS exempt, economies of scale. Nash Industries’ Chennai facility, managed by SafEarth, used this structure to achieve 15% of their near-term carbon reduction target — a milestone toward their 2050 carbon neutrality commitment.
State-by-State Open Access Solar: Where the Market Is Strongest
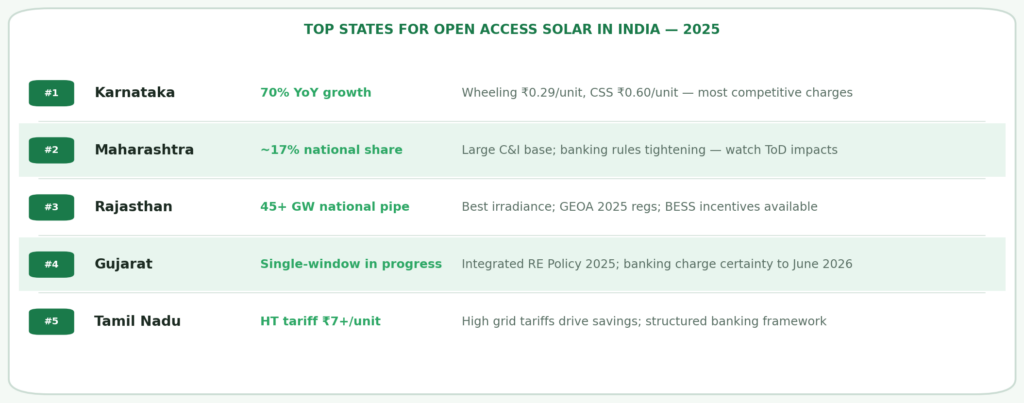
Karnataka, Maharashtra, Rajasthan, Gujarat, and Tamil Nadu together accounted for over 85% of India’s solar open access installations in 2025. Karnataka led with 70% YoY growth, driven by low wheeling charges and new KERC 2025 regulations. Maharashtra’s regulatory clarity on simultaneous rooftop + open access strengthens its position, though tightened banking rules require careful project structuring. Rajasthan offers the best irradiance and is advancing BESS-integrated open access. Gujarat is moving toward single-window clearance. Tamil Nadu’s high industrial tariffs create strong economics even as charges have risen.
What to Watch: Key Open Access Solar Developments in 2026
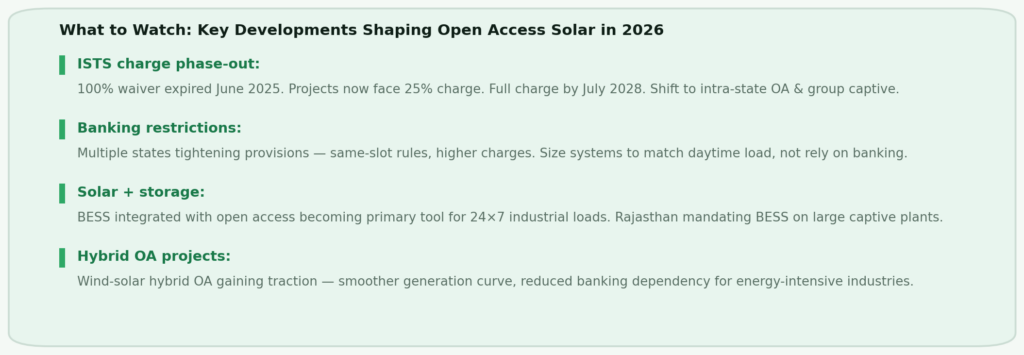
The ISTS charge waiver phase-out — expiring fully in July 2028 — is pushing buyers toward intra-state and group captive structures where state wheeling charges are lower. Multiple states are tightening banking provisions, making load-matched sizing essential. Battery Energy Storage Systems integrated with solar open access are becoming the primary tool for managing banking restrictions and extending usable hours for 24×7 industrial loads. Wind-solar hybrid projects are gaining traction for industries needing consistent round-the-clock generation without banking dependency.
FAQ: Open Access Solar in India
What Is the Minimum Load Required for Open Access Solar in India?
The minimum contract demand is typically 100 kW for renewable open access, though some states require 500 kW. For most industrial electricity consumers — those spending ₹15 lakh or more per month on power — this threshold is easily met. If your rooftop solar capacity has maxed out but consumption continues to grow, open access is the natural next step.
How Is Open Access Solar Different from Rooftop Solar?
Rooftop solar generates on-site — every unit consumed directly saves the full grid tariff, no additional charges. But it’s limited by roof area. Open access solar places the plant at a remote high-irradiance site, wheeling power through the grid to your facility. It scales to any load size but carries CSS, wheeling, and banking charges that don’t apply to captive rooftop generation. Commercial rooftop solar and open access are complementary strategies — most large industrial consumers maximise rooftop first, then use open access to cover the remaining demand.
How Long Does Open Access Solar Approval Take in India?
Approval timelines vary significantly. Karnataka and Gujarat have streamlined to 8–12 weeks for standard configurations. Maharashtra and Tamil Nadu typically require 12–20 weeks. Captive and group captive models require additional steps — shareholder agreements, equity documentation — that can extend timelines. Complete documentation from Day 1 is the single biggest lever for compressing the timeline. See how this process has played out across industries at SafEarth’s case studies.
Is Group Captive Solar Better Than a Third-Party PPA?
In most cases — especially in high-CSS states — yes. Group captive avoids both CSS and Additional Surcharge, which together add ₹1.50–2.50/unit to third-party landed cost. For a consumer using 5 lakh units per month, a ₹1.50/unit CSS saving is ₹7.5 lakh per month — ₹90 lakh per year — in additional savings versus a third-party structure. The 26% equity investment typically recovers within Year 1.
Conclusion: Open Access Solar Is Infrastructure, Not a Product
The most sophisticated energy buyers in India’s industrial sector have stopped treating open access solar as a procurement event and started treating it as infrastructure planning.
A 25-year PPA at ₹3.88/unit all-in, against a DISCOM tariff escalating at 5–8% per year, builds an energy cost advantage that compounds every year the contract runs. The factory that locks in this structure in 2026 is operating from a structurally different cost base than one that waits until 2028 — and the gap between them widens every tariff revision cycle.
The complexity is real: state-level charge structures, banking rules, ISTS dynamics, and model selection require expertise. But the outcome — 30–40% energy cost reduction, locked in for decades — is one of the clearest financial decisions available to large industrial and commercial consumers in India today.
Ready to unlock your solar advantage? Talk to our team of experts at SafEarth — and let’s build the system that works for your facility. Schedule a consultation at safearth.in/contact