Understand industrial solar ROI in 2026 — payback periods, IRR benchmarks, financing models, and how Indian manufacturers are turning energy spend into long-term competitive advantage.

India’s solar capacity crossed 140 GW by January 2026, with the country adding a record 36.6 GW in 2025 — a 43% jump year on year. Open-access projects accounted for 26% of large-scale additions, reflecting growing demand from commercial and industrial consumers seeking cost savings and energy security. The numbers behind that shift aren’t environmental targets. They’re IRRs, payback curves, and operating margin improvements
This post breaks down exactly what industrial solar ROI looks like in 2026 — the benchmarks, the variables that move the needle, the financing structures available, and the questions every CFO and plant head should be asking before the next tariff revision hits.
Why Industrial Solar ROI Has Improved Significantly in 2026
The economics of industrial solar ROI have never been stronger, and the reasons are structural rather than cyclical. Grid electricity tariffs for high-tension industrial consumers across India now range from ₹8 to ₹12 per unit depending on state and sanctioned load. Solar generation costs — for captive rooftop systems — have stabilised at ₹3–4 per unit over the plant’s operational life. That gap is the engine of ROI.
Falling CAPEX, Rising Grid Rates
Solar panel prices stabilised after the volatility of 2022–2024, delivering the best price-to-performance ratio in history. Meanwhile, state electricity regulatory commissions continue shifting fixed cost recovery onto commercial and industrial consumers, compressing the value of load management while increasing the value of captive generation.
India’s Open Access Solar Market at Scale
India’s cumulative installed solar open access capacity exceeded 30 GW as of December 2025. For industries without sufficient rooftop area, open access solar now provides a scalable second route — with captive and group captive models offering the best savings profile by avoiding cross-subsidy surcharge and additional surcharge charges. Solar decisions are now increasingly driven by economics, reliability, and long-term cost visibility, not incentives alone.
What Does Industrial Solar ROI Actually Look Like in 2026?
Payback Period Benchmarks
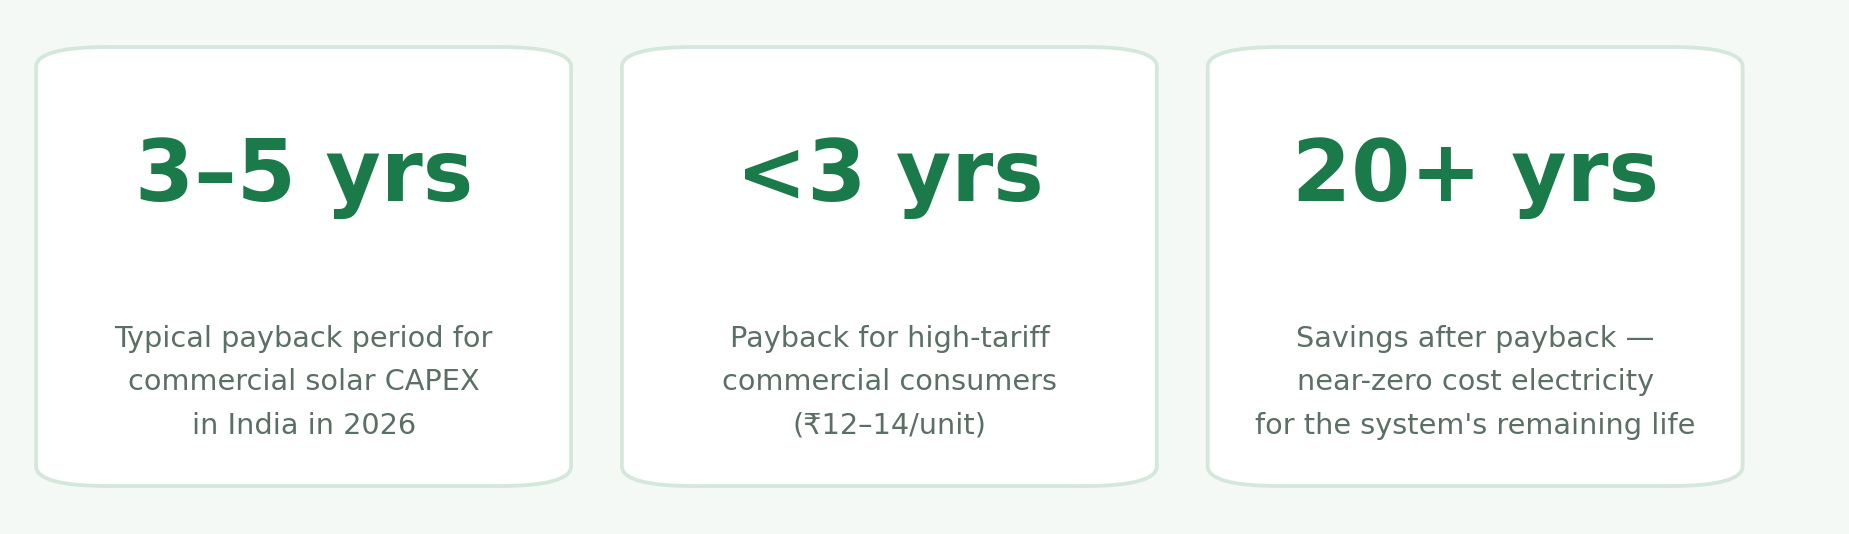
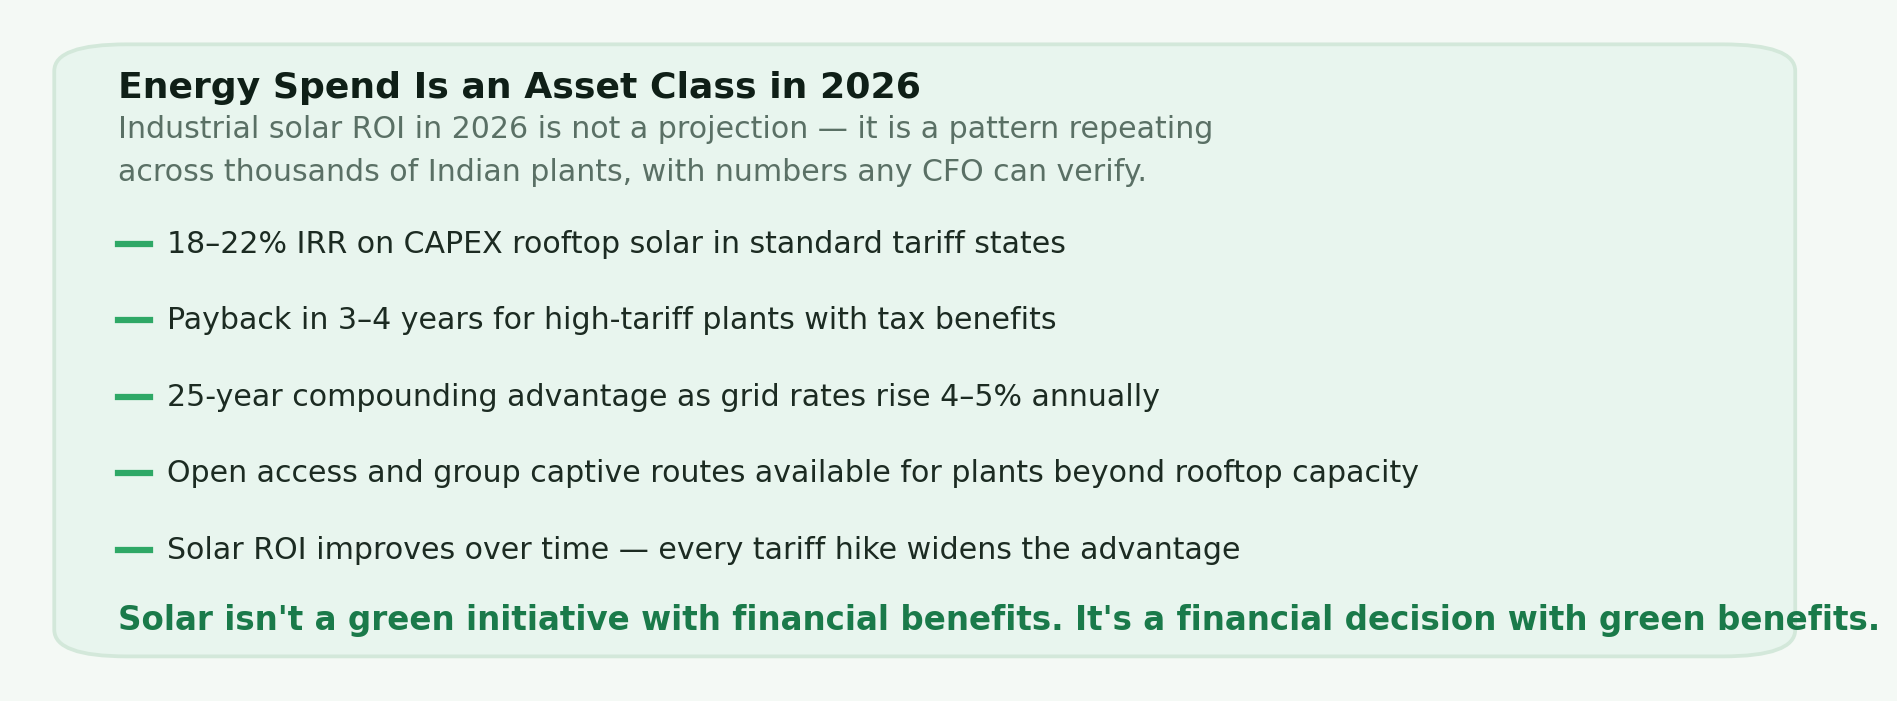
Businesses can expect 18–22% internal rate of return in 2026, with rooftop solar payback periods of 3–4 years and ground-mounted industrial solar at 4–5 years under the CAPEX model. For commercial and industrial installations in India, the financial payback period typically ranges from 3 to 6 years depending on local tariffs, system sizing, and available incentives. High-tariff states like Maharashtra, Karnataka, and Tamil Nadu often compress this under 3.5 years.
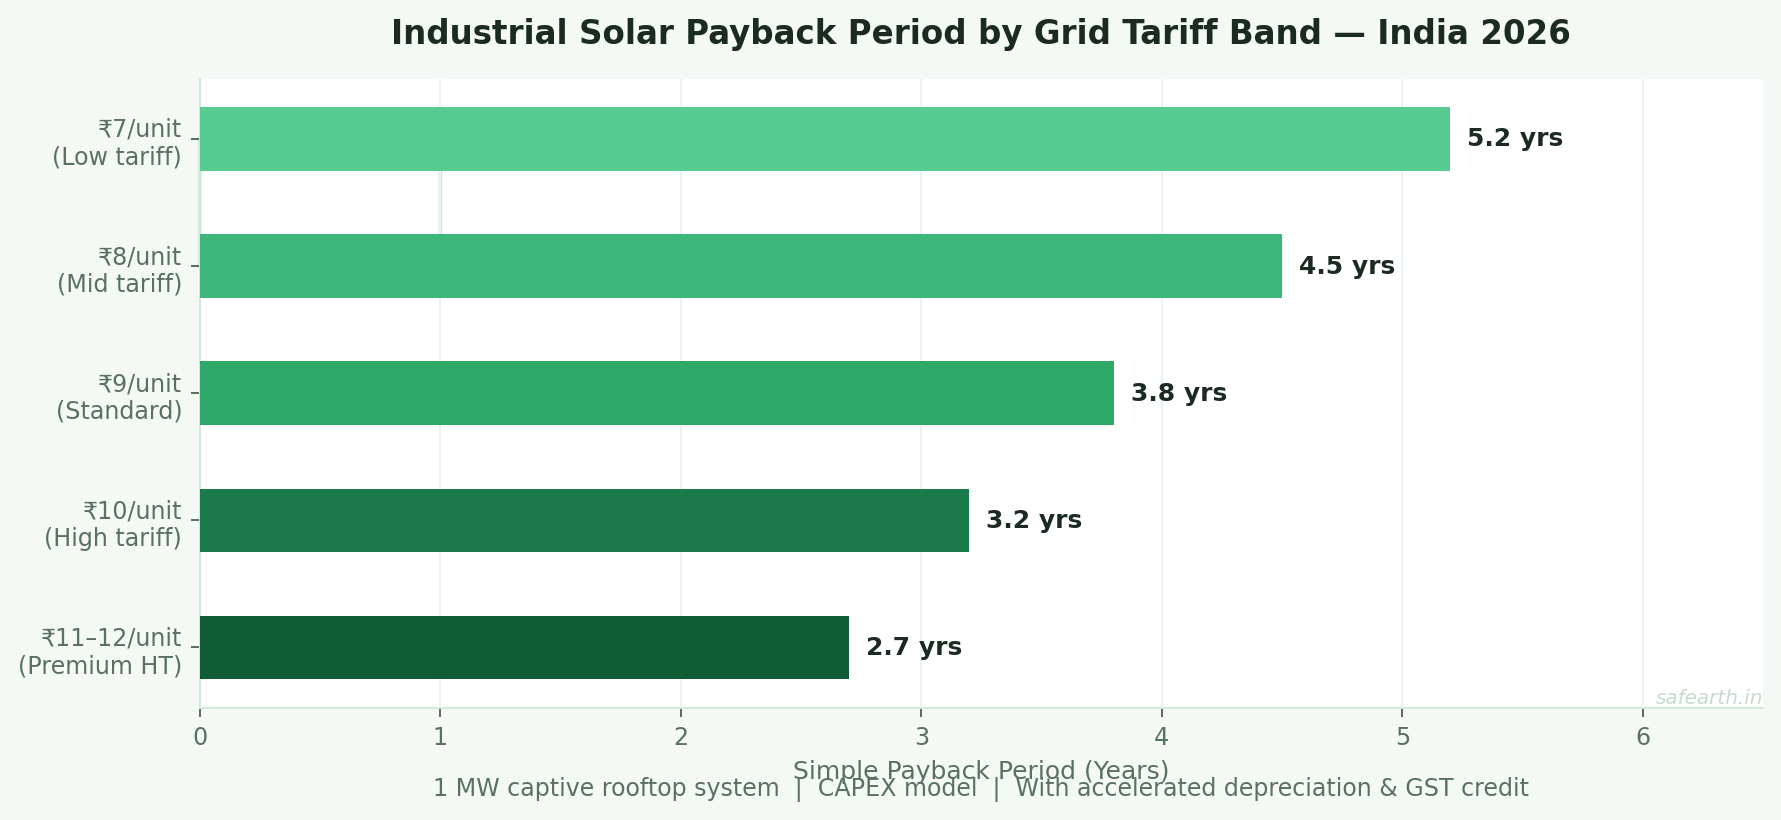
Horizontal bar chart showing industrial solar payback period by grid tariff band in India 2026 — ranging from 5.2 years at 7 rupees per unit to 2.7 years at 11 to 12 rupees per unitIndustrial solar payback period by grid tariff band. 1 MW CAPEX system. With accelerated depreciation and GST credit applied.
What Accelerated Depreciation Does to the ROI Calculation
Most financial models for industrial solar ROI understate returns because they don’t fully account for India’s tax incentives. Under Section 32 of the Income Tax Act, solar power systems qualify for 40% accelerated depreciation in Year 1 — with an additional 20% available if the plant is commissioned and operational for more than 180 days within the financial year.
On a ₹5 crore solar plant, that means ₹2 crore in depreciation in Year 1 alone. At a 25% effective tax rate, the cash flow benefit is ₹50 lakh — before a single unit of solar electricity is generated. For a typical commercial installation, the payback period can reduce from 5–6 years to 3–4 years when tax incentives are effectively utilised.
The Three Variables That Determine Your Actual Solar ROI
Industrial solar ROI isn’t a single number. It is a function of three variables that every plant operator can influence at the planning stage.
1. Your Current Grid Tariff
This is the single biggest driver of solar ROI. The higher your existing per-unit cost, the larger the spread against solar’s ₹3–4/unit generation cost, and the faster your payback. A plant paying ₹11/unit in Maharashtra will see materially stronger returns than one paying ₹7.5/unit in a lower-tariff state. Run your calculation against your actual tariff — not an average.
2. System Sizing and Load Matching
Solar generation peaks between 8am and 5pm. Plants with high daytime consumption — manufacturing lines, cooling systems, compressed air — capture the full value of every unit generated. Factories with high electricity costs and large daytime operations usually recover costs faster — often within 3 years. Plants with significant night-shift consumption or low daytime load will generate surplus they can’t use without net metering or banking mechanisms.
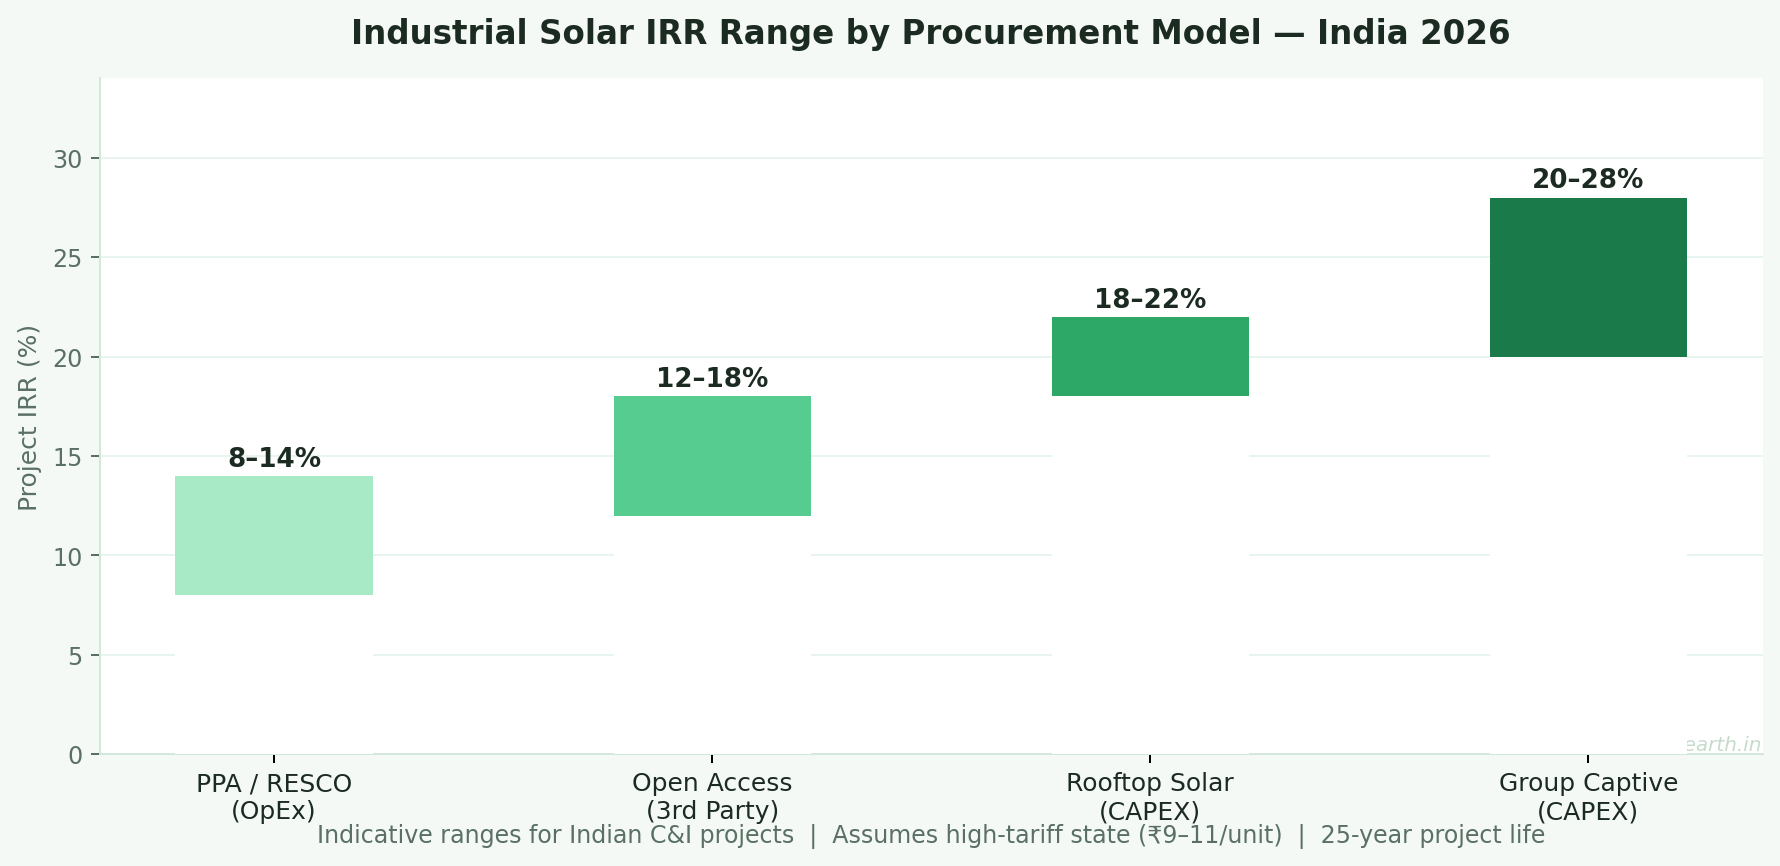
3. Procurement Model: CAPEX vs PPA vs Group Captive
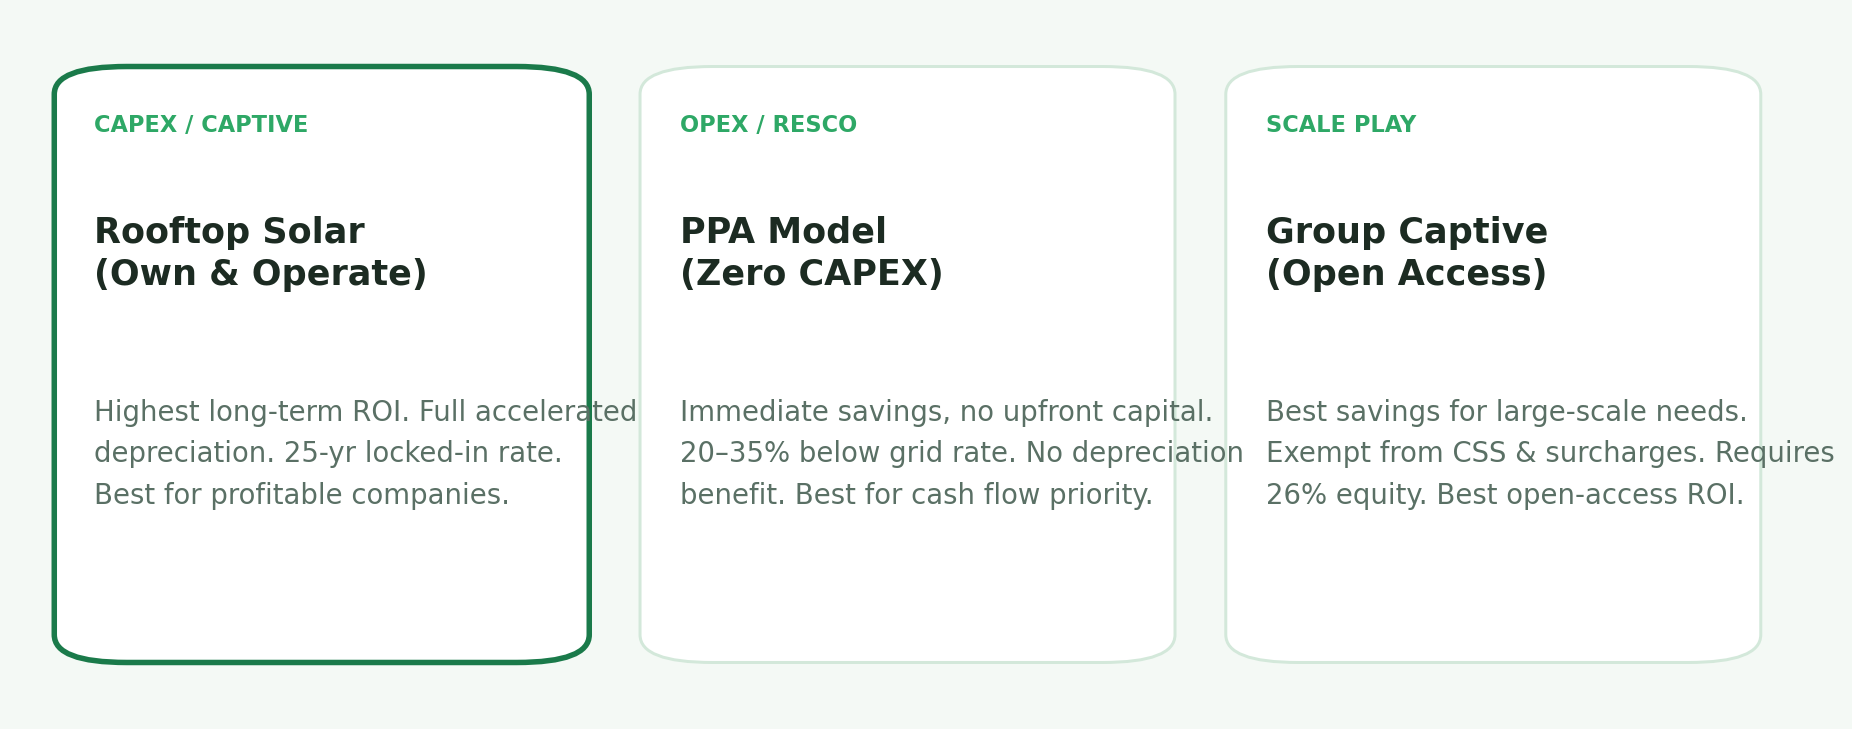
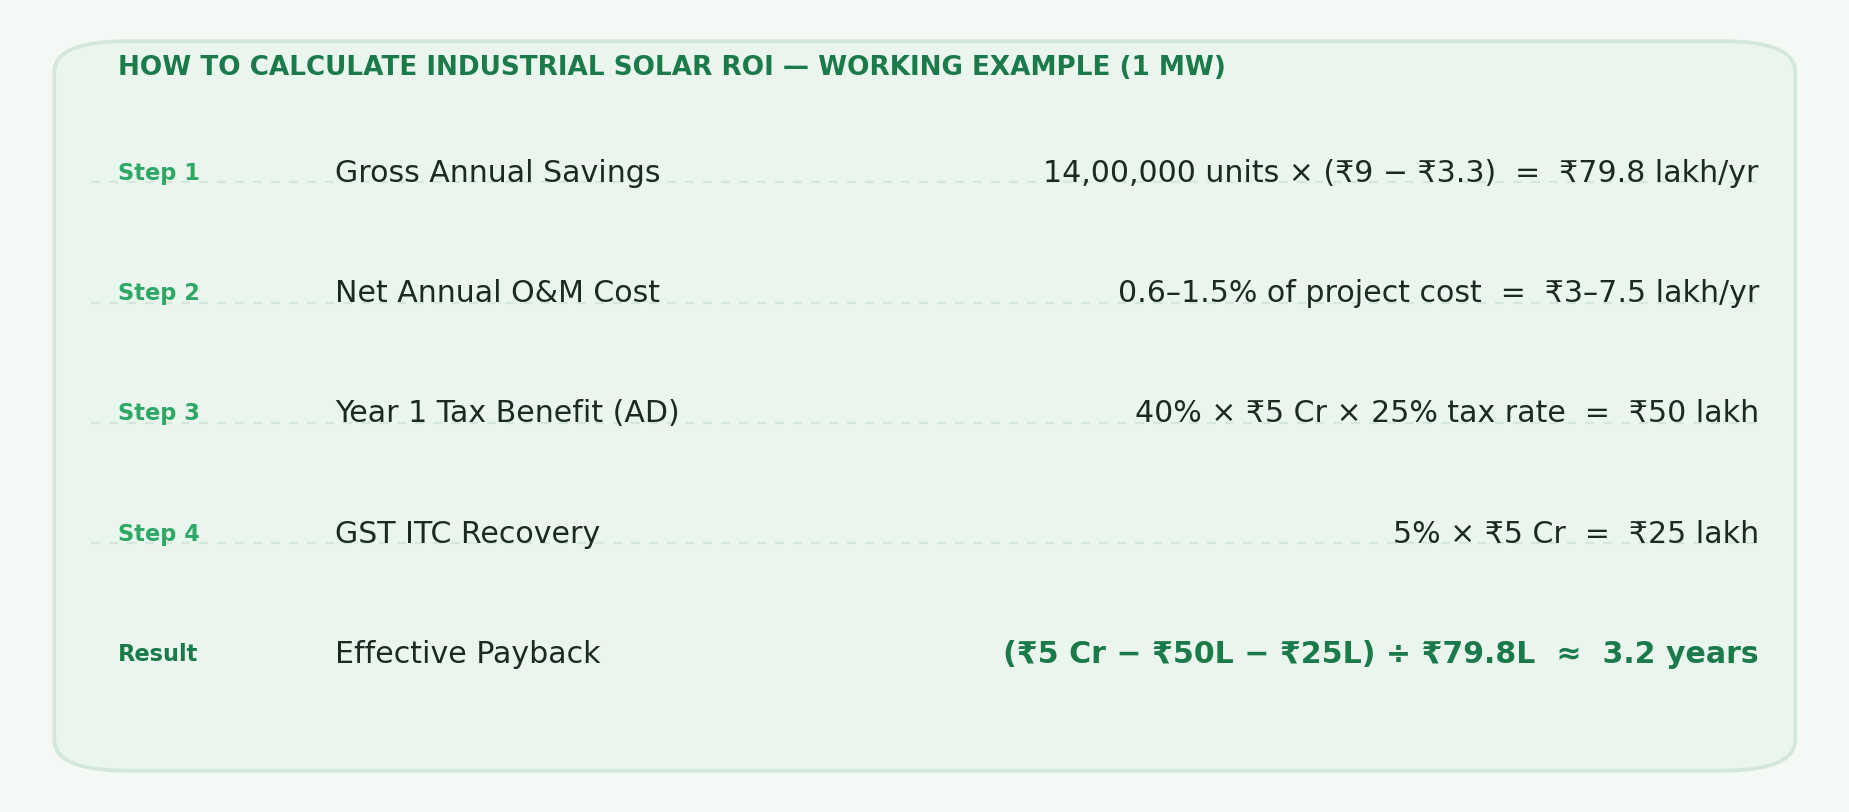
How to Calculate Industrial Solar ROI: A Working Framework
The standard ROI formula — (Annual Energy Savings ÷ Total Investment) × 100 — understates true returns for industrial buyers who have access to depreciation benefits and GST credits. A more complete framework accounts for four components:
Use SafEarth’s industrial solar ROI calculator to model your facility’s specific numbers — including state-level tariff data and financing options.
Industrial Solar ROI by Sector: Where Returns Are Highest
Not all manufacturing categories see equal returns. The sectors with the highest industrial solar ROI share a common characteristic: high electricity consumption concentrated in daytime operating hours.
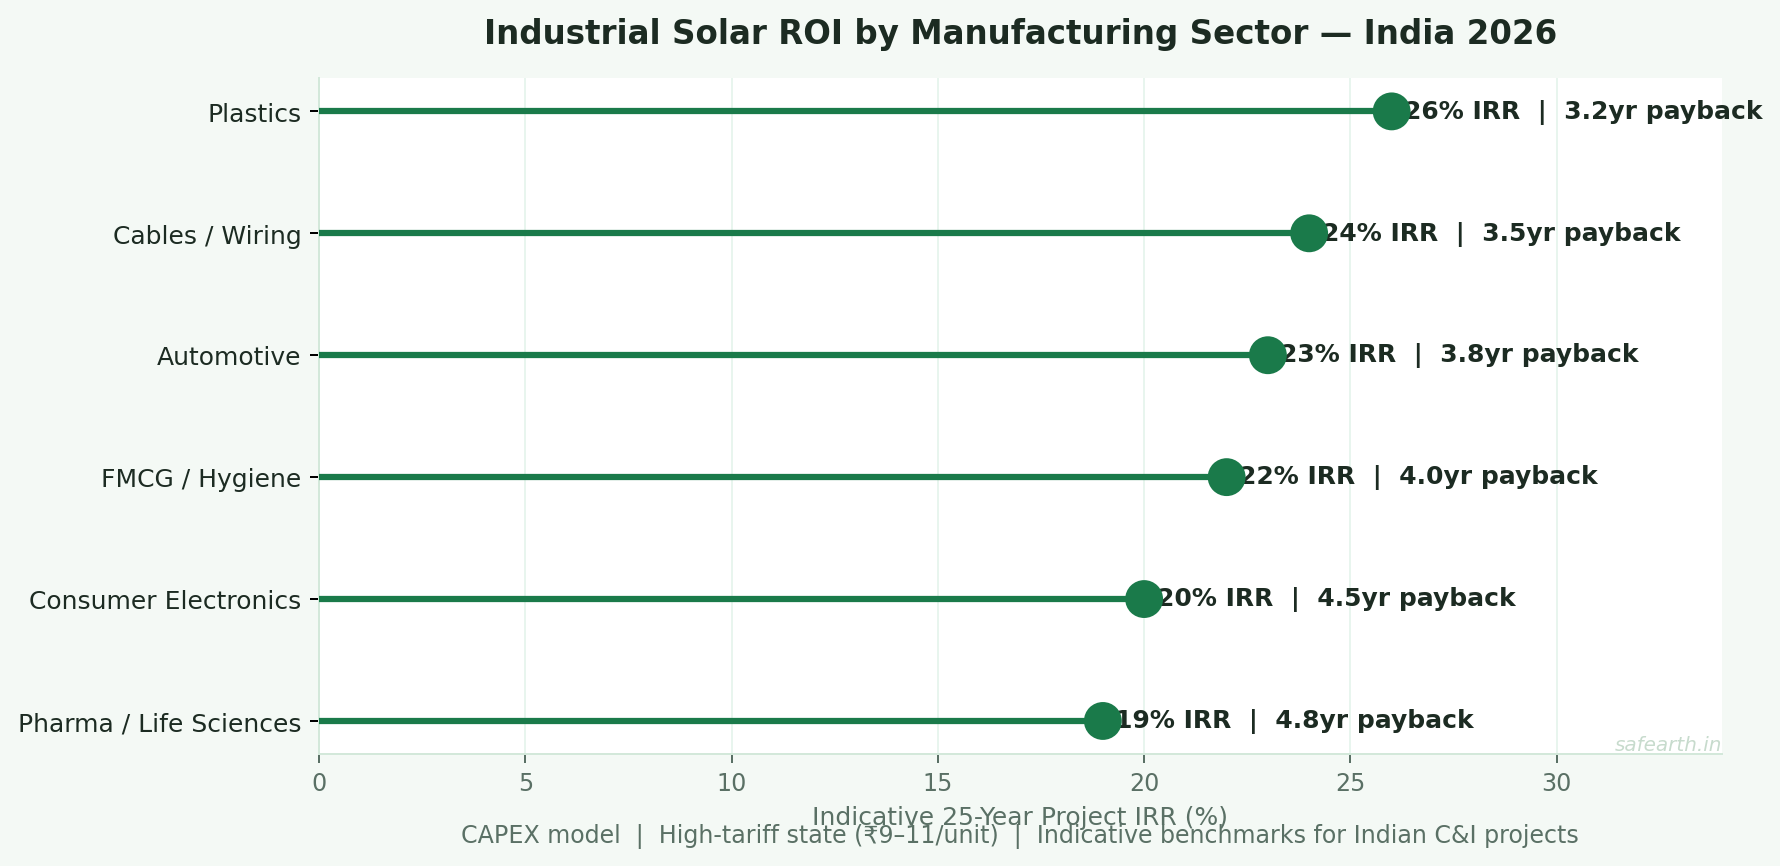
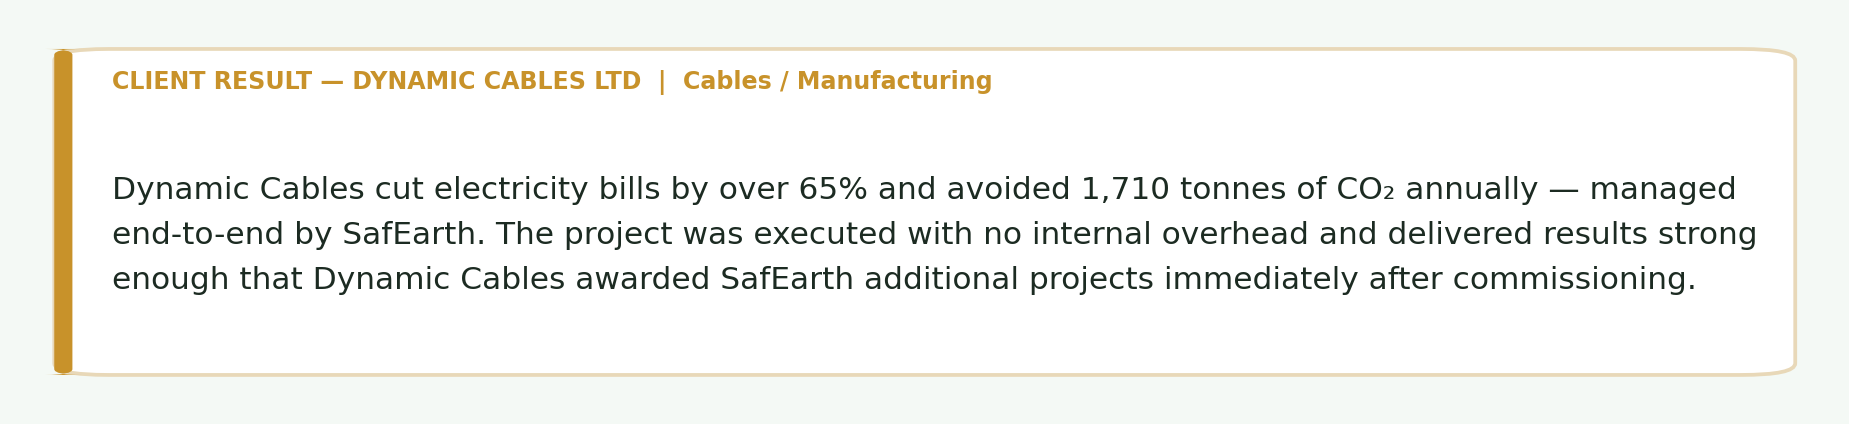
Plastics and Cables Manufacturing
Energy-intensive continuous-process industries — extruders, injection moulding, cable drawing lines — run 12–16 hours per day, with peak loads during solar generation hours. Electricity typically represents 8–12% of revenue. ROI is correspondingly strong: payback periods of 3–4 years are common, with 25-year IRRs consistently above 20%.
Automotive and Electronics Manufacturing
Plants in this segment often have large rooftop areas relative to consumption, making 1 MW+ captive systems viable. Toyota Techno Park India installed a high-quality rooftop solar system through SafEarth with consistent quality assurance that protected long-term generation performance. Ather Energy engaged SafEarth for a detailed technical evaluation of their manufacturing-scale solar requirements — ensuring the system was sized correctly for their specific load profile before committing capital.
Pharma and Life Sciences
Multi-shift operations, climate-controlled environments, and stringent uptime requirements make solar particularly attractive for this sector. Sartorius Stedim started their solar journey with SafEarth in 2021 with no prior execution experience and has since deployed across multiple facilities. Access detailed outcomes across all sectors at SafEarth’s case studies.
FAQ: Industrial Solar ROI in India 2026
1. What Is a Realistic IRR for Industrial Solar in India in 2026?
Most industrial solar projects deliver an annual ROI of 20–35%, depending on energy consumption, tariff rates, and system efficiency. For CAPEX-owned rooftop systems in high-tariff states, IRR of 22–28% is achievable when tax benefits are fully utilised. PPA models deliver lower IRR since savings are shared with the developer, but require no capital deployment. The 25-year horizon is what makes the investment truly compelling — cumulative savings of ₹55–70 crore on a ₹5 crore initial investment in high-tariff scenarios.
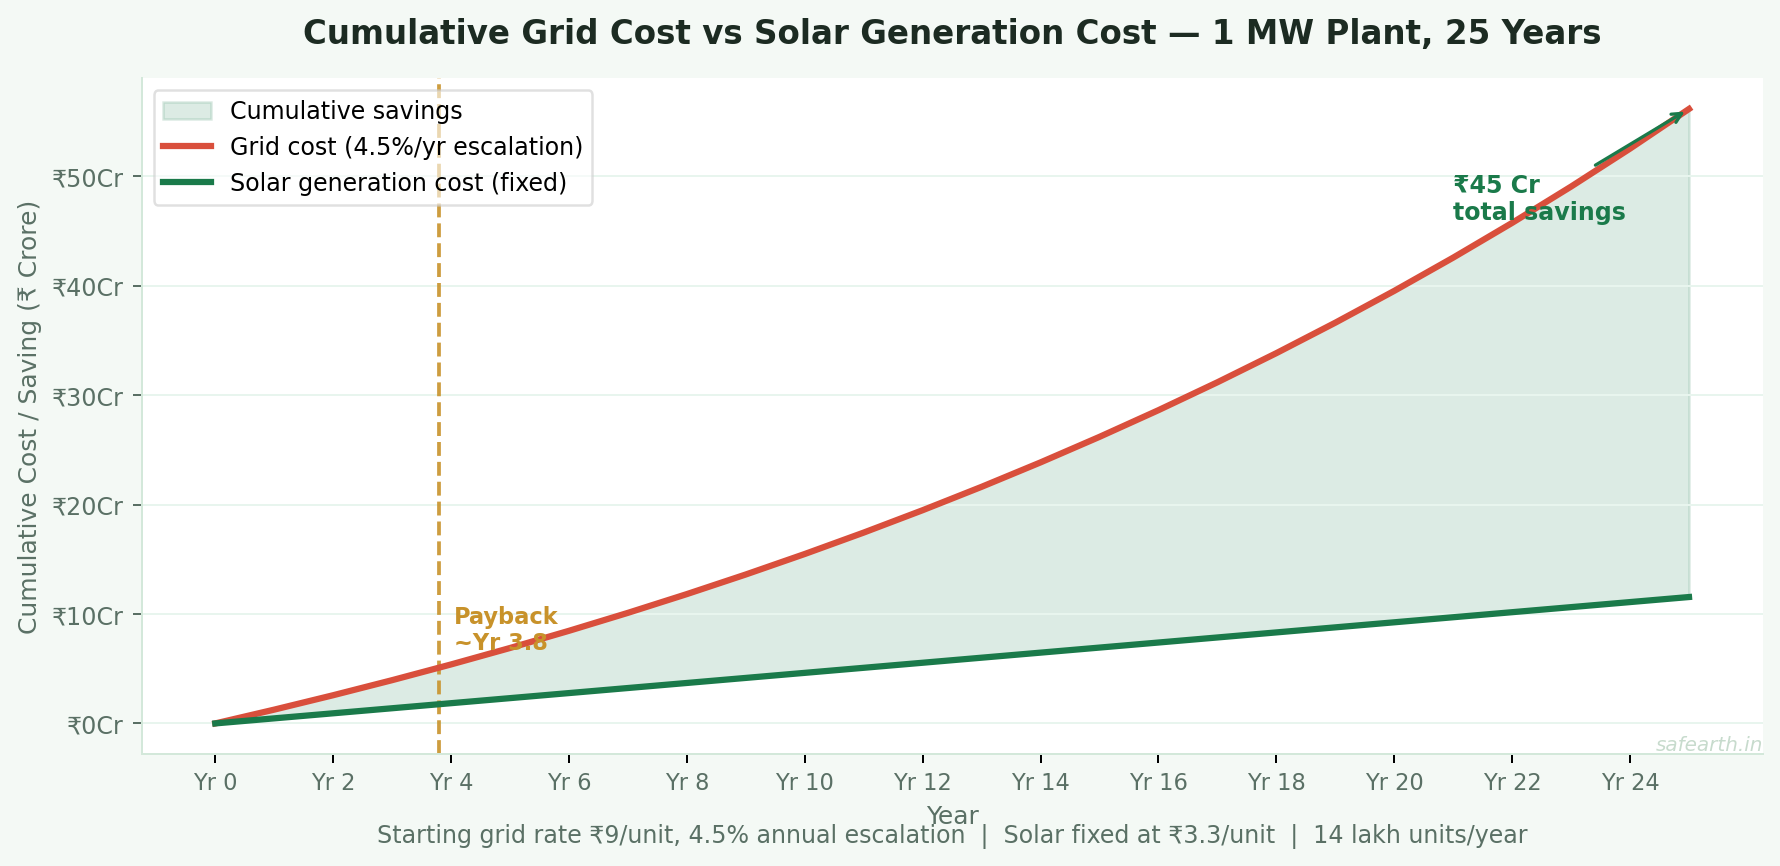
2. How Does Grid Tariff Escalation Affect Solar ROI Over Time?
Every time your state DISCOM raises tariffs — which historically occurs every 1–3 years — the value of your captive solar generation increases automatically. Your solar rate stays fixed at ₹3–4/unit while the cost of every unit you don’t generate from solar keeps rising. Plants that installed 5 years ago at ₹7/unit grid rates are now avoiding costs at ₹10–11/unit — nearly 50% more than their original savings calculation. Solar ROI improves over time, not just at commissioning.
3. Is Solar ROI Different for Open Access vs Rooftop Projects?
Yes, materially. Rooftop CAPEX projects deliver the highest ROI because they capture the full spread between solar generation cost and grid tariff, plus accelerated depreciation. Open access third-party projects pay cross-subsidy surcharge and additional surcharge in most states, reducing the savings margin. Captive and group captive models offer the best savings by avoiding these charges — with industrial consumers in some states saving ₹2.25/kWh or more against grid rates.
4. What Size Solar Plant Should an Industrial Company Install for Best ROI?
The optimal size is determined by your daytime load — not your total consumption. Over-sizing relative to daytime usage creates surplus you can’t consume and can’t monetise efficiently. Under-sizing leaves large portions of the grid bill untouched and extends payback unnecessarily. SafEarth’s approach begins with a feasibility study and Detailed Project Report (DPR) — delivered in 48 hours — that models optimal sizing based on your load profile, tariff category, roof area, and procurement model. For larger industrial facilities, the 1MW solar plant guide covers cost, timeline, and ROI benchmarks in detail.
Reach out to our team of experts to start your evaluation for a solar installation.