

India’s industrial electricity tariffs for high-tension consumers now range from ₹7 to ₹12 per unit across states. Solar captive generation costs ₹3–3.5 per unit and stays there for 25 years. Over a 20–25 year system life, industrial plants can save 60–80% on electricity costs through solar — and in the near term, high-tariff consumers are recovering their investment in under 3 years. This post gives you the actual numbers — by plant size, by state, and by sector.
What Drives Industrial Solar Savings in India?
Three variables determine how much an industrial plant saves with solar. For C&I buyers facing industrial grid tariffs of ₹6–8/kWh in states like Karnataka and Maharashtra, solar delivers landed costs as low as ₹3.5–4.5/kWh — translating to savings of 30–40% on annual energy bills. At ₹10–12/unit, the spread widens further and savings cross 50–60%.
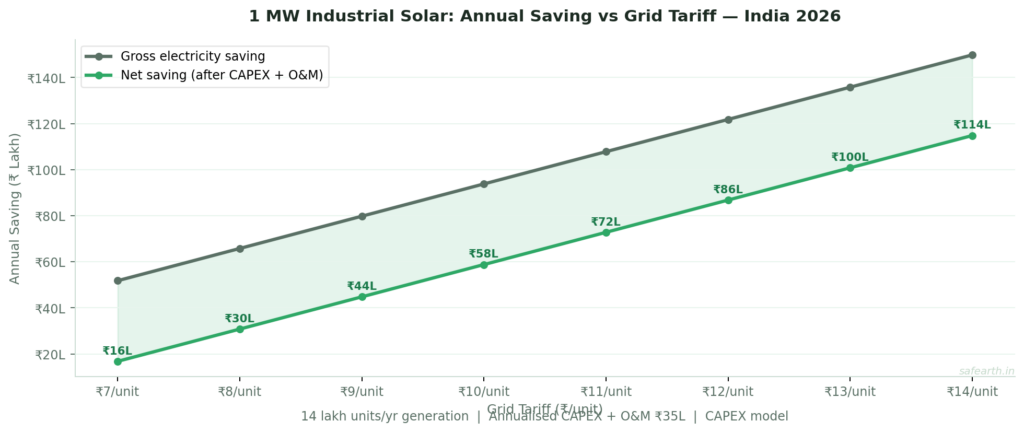
Every ₹1/unit increase in your grid tariff adds roughly ₹10–14 lakh per year to a 1 MW system’s annual savings. Your daytime load profile is the second driver — plants with high continuous daytime consumption capture the highest savings. The third is system sizing: a system where 85–95% of generation is consumed directly consistently outperforms in savings efficiency.
Industrial Plant Solar Savings by System Size — Real Rupee Numbers
| System Size | Annual Generation | Grid Cost Offset | Net Annual Saving |
|---|---|---|---|
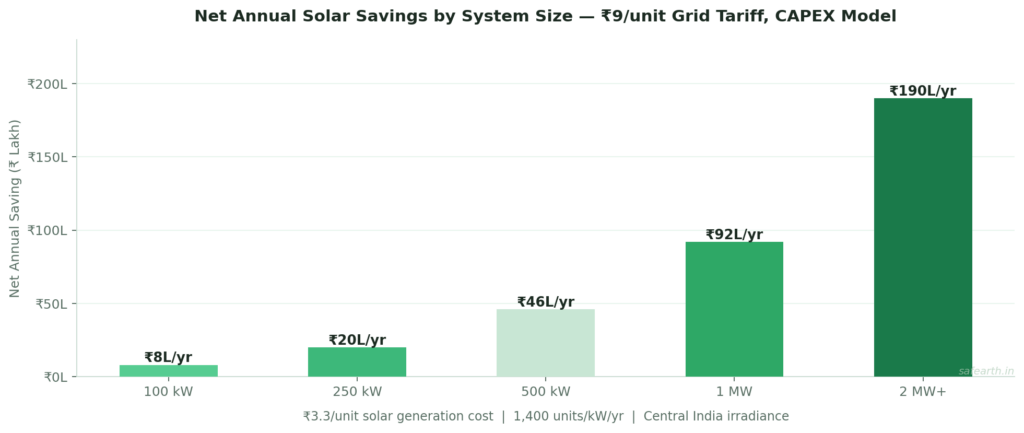
| 100 kW | ~1.4 lakh units | ₹12.6 lakh | ₹7–9 lakh |
| 250 kW | ~3.5 lakh units | ₹31.5 lakh | ₹17–23 lakh |
| 500 kW | ~7.2 lakh units | ₹64.8 lakh | ₹42–50 lakh |
| 1 MW | ~14 lakh units | ₹1.26 crore | ₹86–98 lakh |
| 2 MW+ | ~28+ lakh units | ₹2.52 crore+ | ₹1.8–2.0 crore |
₹9/unit grid tariff, ₹3.3/unit solar generation cost, CAPEX model. High-tariff states add 30–50% to each figure.
What Tax Benefits Add to Your Industrial Solar Savings
This is where most initial projections understate the true financial outcome. Industrial plants that own their solar systems under the Capex model access two tax levers that materially reduce effective investment.
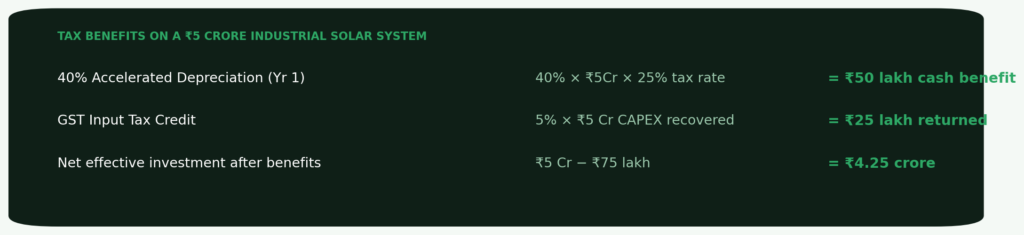
Under Section 32 of the Income Tax Act, solar installations qualify for 40% accelerated depreciation in Year 1. On a ₹5 crore plant at 25% effective tax rate, that’s ₹50 lakh in cash flow benefit — exclusive to asset-owning businesses. The 5% GST on solar equipment is fully recoverable as ITC — returning ₹25 lakh on ₹5 crore CAPEX. Together these benefits reduce the net investment to ₹4.25 crore before electricity savings begin.
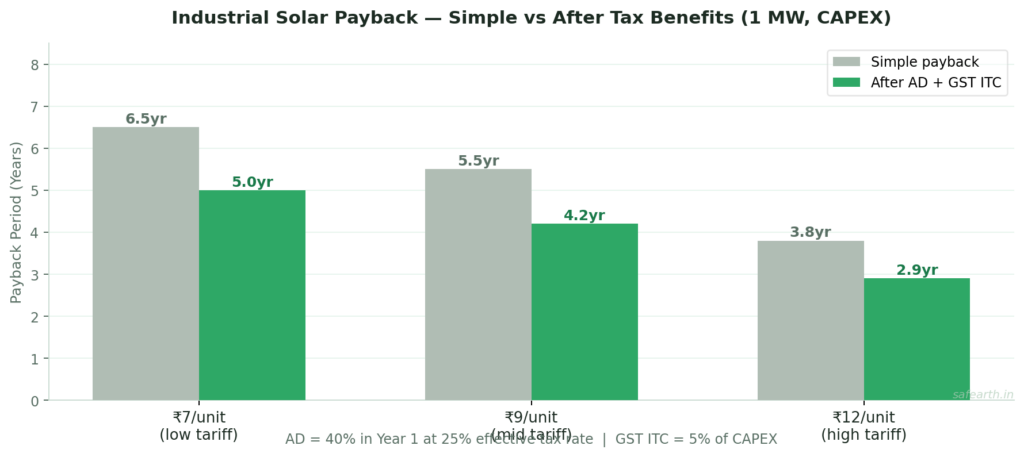
Tax benefits consistently reduce effective payback by 12–18 months. At ₹12/unit in a high-tariff state, the combined effect delivers payback under 3 years. See the full model in SafEarth’s Capex vs PPA guide.
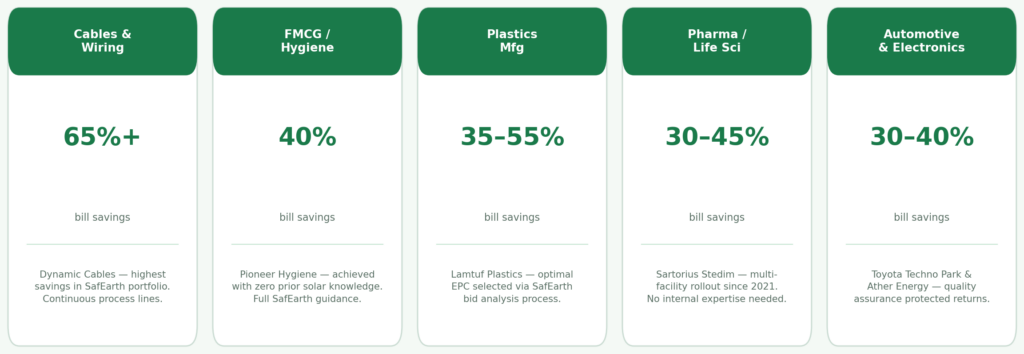
Solar Savings by Industry Sector — SafEarth Client Results

Atomberg’s CFO noted they needed a true end-to-end partner — not a consultant. Ather Energy engaged SafEarth for a detailed technical evaluation of their manufacturing-scale solar requirements. Toyota Techno Park India praised SafEarth’s proactive quality assurance throughout their rooftop project. See the full case library at SafEarth’s case studies.
The 25-Year Industrial Solar Savings Picture: What Happens After Payback
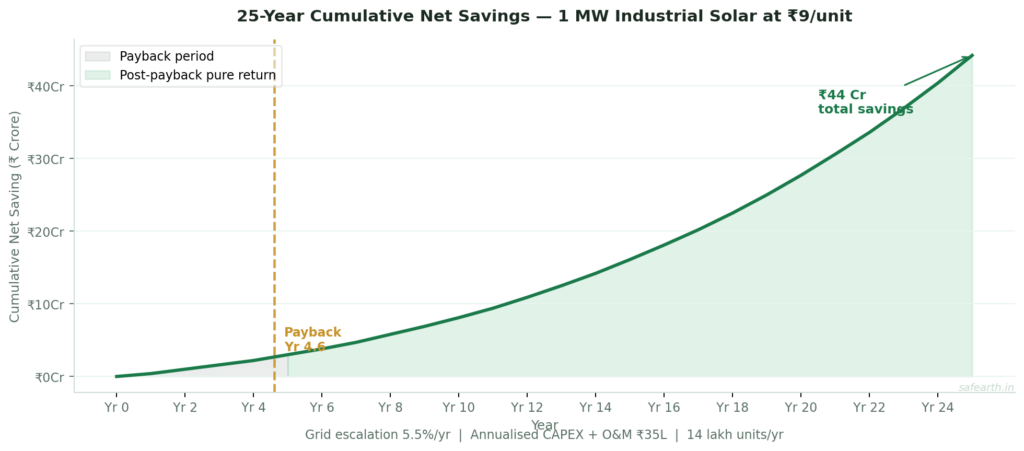
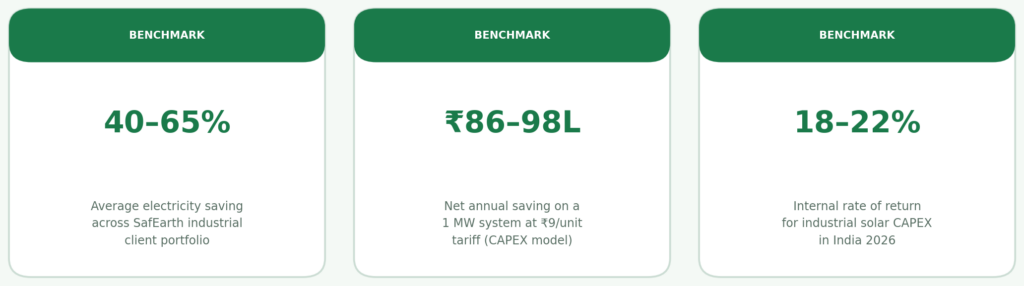
Businesses can expect 18–22% internal rate of return in 2026, with savings of 60–80% on electricity costs over a 20–25 year system life. A plant saving ₹86 lakh in Year 1 against a ₹9/unit tariff is saving over ₹1.5 crore annually by Year 10 — on the same system, with no additional investment.
How Open Access Solar Changes the Industrial Savings Calculation
For industrial plants with loads exceeding rooftop capacity, open access solar provides a second route to structural energy cost reduction. Group-captive structures avoid cross-subsidy surcharge and additional surcharge under the Electricity Act 2003 — making landed costs substantially lower than third-party open access. Nash Industries’ Chennai facility used group captive solar to achieve 15% of their near-term carbon reduction target — a milestone toward their 2050 carbon neutrality commitment.
FAQ: Industrial Plant Solar Savings in India
How Much Can a 1 MW Solar Plant Save a Factory in India Per Year?
At ₹9/unit grid tariff, a 1 MW industrial solar plant generating approximately 14 lakh units annually avoids ₹1.26 crore in grid electricity costs. After annualised CAPEX and O&M, net annual saving is typically ₹86–98 lakh. At ₹12/unit — common for commercial-category industrial consumers in Maharashtra and Tamil Nadu — the same system saves ₹1.2–1.4 crore net annually. Use SafEarth’s solar savings calculator to model your facility’s exact numbers.
Does Solar Save More Money in High-Tariff States?
Yes — significantly. Every ₹1/unit increase in grid tariff adds roughly ₹14 lakh per year to a 1 MW system’s savings. Maharashtra commercial consumers paying ₹12–14/unit see payback under 3 years and net 25-year savings well above ₹15 crore on a ₹5 crore investment. Karnataka’s high HT tariffs combined with India’s lowest open access wheeling charges make it the most competitive state for both rooftop and open access industrial solar.
Can a Factory Increase Its Solar Savings Using Tax Benefits?
Yes. Accelerated depreciation (40% in Year 1) and GST input tax credit (5% of system cost) together reduce effective net investment on a ₹5 crore system by ₹75 lakh — shortening payback by 12–18 months. These benefits apply exclusively to Capex-owned systems. PPA models do not qualify. See the full comparison in SafEarth’s Capex vs PPA guide.
What Is the Minimum Monthly Bill That Makes Industrial Solar Worthwhile?
Industrial solar becomes financially compelling at approximately ₹5 lakh or more per month on electricity. Above ₹15–20 lakh/month, solar is one of the highest-returning capital investments available on the balance sheet — delivering consistent, compounding returns for 25 years. Use SafEarth’s industrial solar ROI calculator to model your specific situation.
Conclusion: The Saving Is Real — and It Grows Every Year
Industrial plants in India that have gone solar are not saving 10–15% on energy. They’re saving 40–65%, in some cases more — and the saving grows every year as grid tariffs rise while their solar generation cost stays fixed.
The CFO who models industrial solar savings only at today’s tariff rate is underestimating the return. The right model projects the saving across 25 years, applies actual tax benefits in the first year, and compares the risk-adjusted return against every other capital deployment option on the table.
Most of them don’t compare favourably.
Ready to unlock your solar advantage? Talk to our team of experts at SafEarth — and let’s build the system that works for your facility. Schedule a consultation at safearth.in/contact