
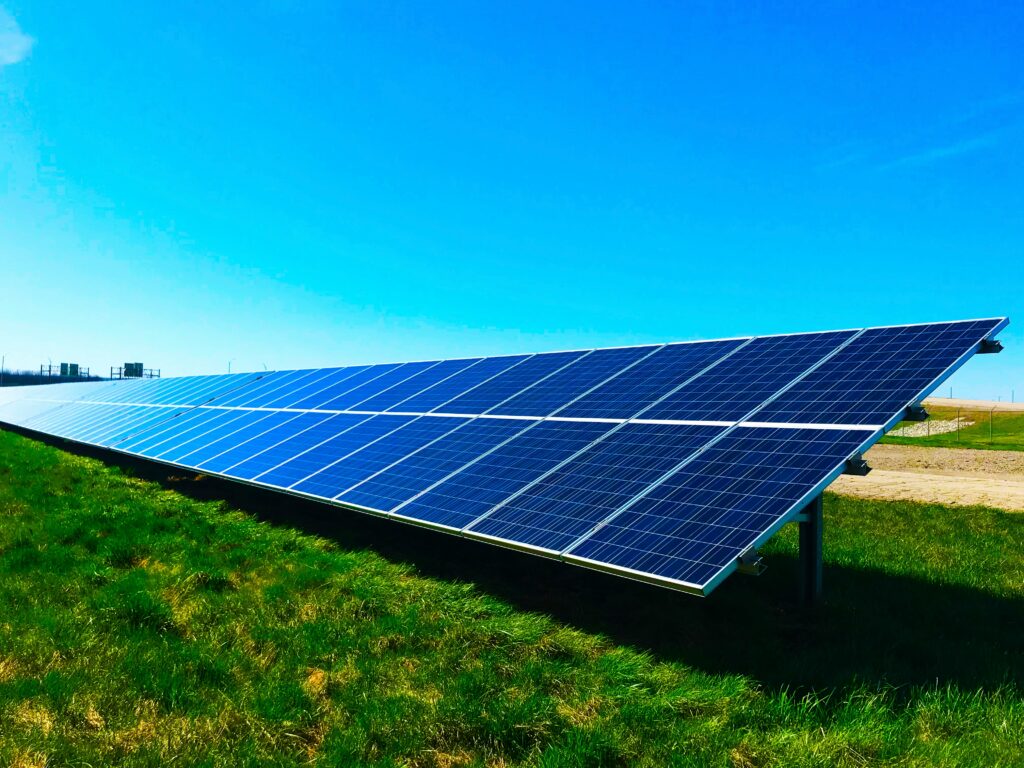

The decision between ground mounted and rooftop solar for industrial facilities has real consequences for system performance, CAPEX, O&M cost, land use, and the 25-year return on your investment. Each model has a clearly defined set of conditions where it wins. Here is a clear-eyed breakdown of both options, what drives the economics of each, and the framework to choose the right one for your facility.
What Is Rooftop Solar for Industrial Facilities?
Rooftop solar installs photovoltaic panels directly on the existing roof structure of your factory, warehouse, or industrial building. Industrial facilities typically have large, flat roof areas that are significantly under-utilised — converting these to energy-generating assets creates immediate value without additional land acquisition costs.
Rooftop solar is the dominant choice for urban and semi-urban industrial facilities where land is scarce or expensive. It is also the lowest-cost entry point for most C&I solar procurement — no land CAPEX, lower civil work, and immediate use of existing infrastructure. Where it wins: urban industrial zones, facilities with large structurally sound roofs, and businesses prioritising the fastest payback.
What Is Ground Mounted Solar for Industrial Facilities?
Ground mounted solar installs panels on metal structures fixed to open land — within or adjacent to the facility’s premises. The system sits at optimal tilt angles, can incorporate single-axis or dual-axis tracking, and is unconstrained by roof geometry or building maintenance schedules. Ground mounted solar offers better design freedom — panels can be oriented optimally for maximum irradiance, and tracking systems can increase generation by 5–12% compared to fixed rooftop systems.
For industrial facilities with significant landholding — industrial parks, campuses, facilities in Tier 2/3 locations — ground mounted solar can scale to meet any load requirement without the structural constraints of a roof. India added 34.8 GW of new ground-mounted solar capacity in FY2026 alone — a 106% increase — with C&I open access making a substantial contribution.
Ground Mounted vs Rooftop Solar: Direct Comparison
Cost
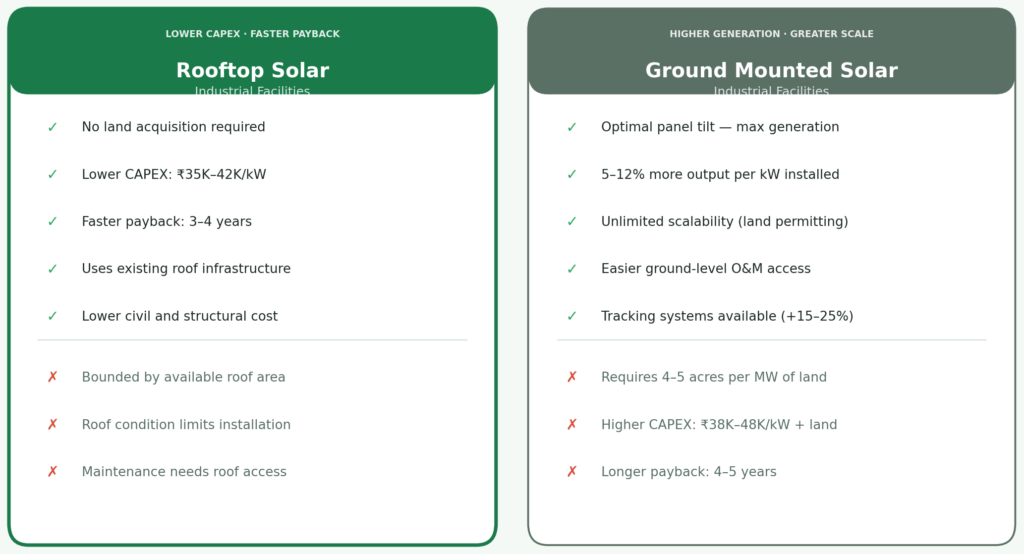
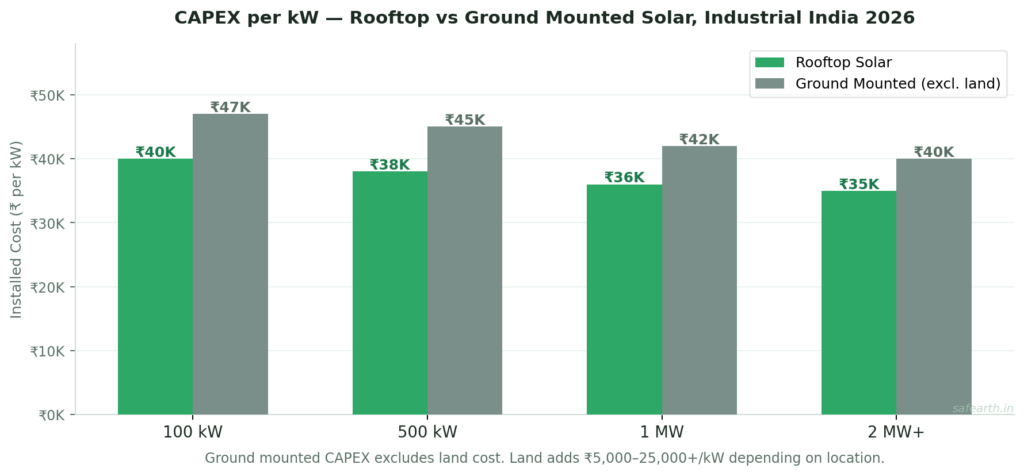
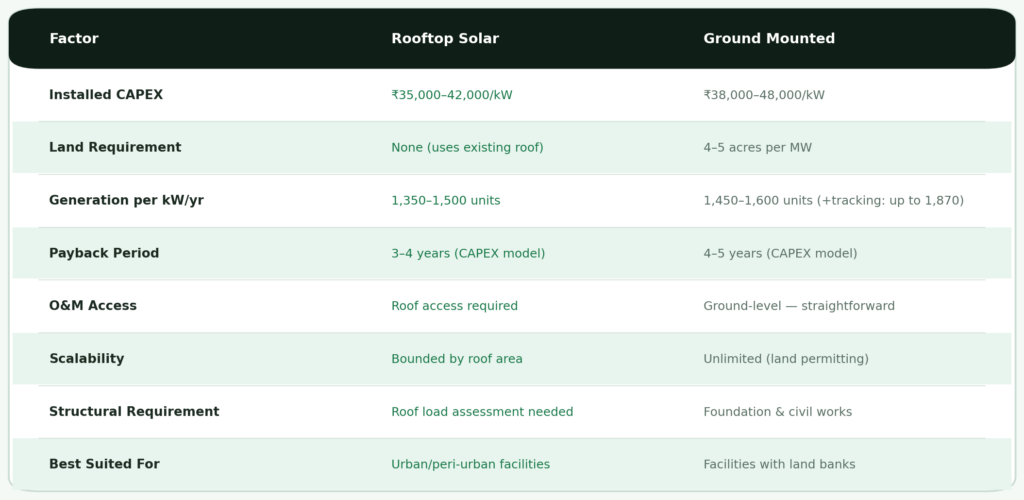
Rooftop solar carries lower civil and structural costs — no land preparation, no deep foundation work, no perimeter fencing. Ground mounted systems offer higher efficiency and easier maintenance but require more land and carry higher installation costs. When land acquisition cost is included, the effective CAPEX premium of ground mounted widens significantly in urban industrial belt areas.
Efficiency and Generation
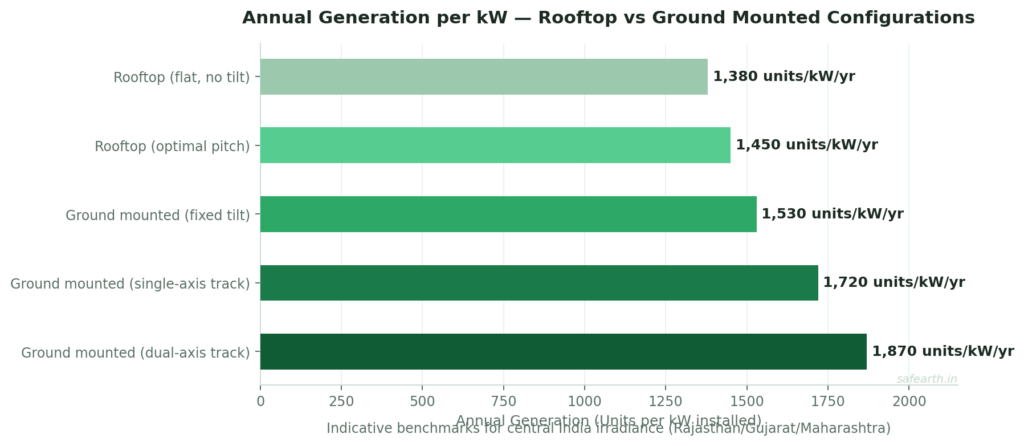
India’s total installed solar capacity reached 102.57 GW by February 2025 — 78.47 GW from ground mounted systems and 16.66 GW from rooftop. The dominance of ground mounted in national capacity reflects its performance advantages at scale. For industrial buyers: rooftop generates 1,350–1,500 units/kW/year, ground mounted generates 1,450–1,600 units/kW/year fixed, and up to 1,870 units/kW/year with dual-axis tracking — a 25%+ premium over standard rooftop.
O&M and Maintenance
Ground mounted systems allow regular cleaning by ground-based teams without scaffolding, easy inverter access, and independent maintenance scheduling not tied to facility shutdown windows. For industrial O&M over a 25-year horizon, the access advantage of ground mounted typically translates to 5–8% higher actual vs. design generation — because maintenance is done more frequently when it doesn’t require roof access. SafEarth’s solar O&M services handle both configurations with predictive maintenance and real-time monitoring.
Payback Period: How the Economics Compare
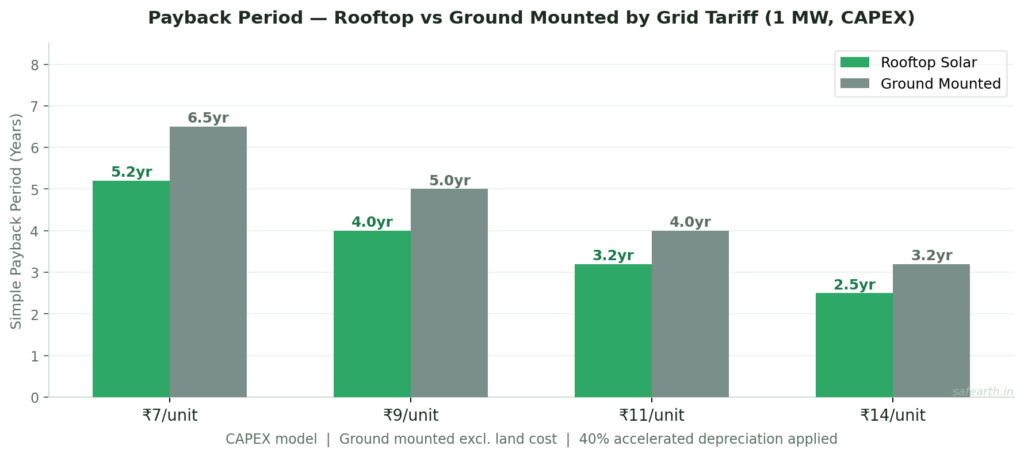
Both rooftop and ground mounted qualify equally for 40% accelerated depreciation in Year 1 under Section 32, 5% GST input tax credit, and 25-year generation with near-zero variable cost. The payback gap between models — typically 1–1.5 years — reflects the CAPEX difference, not any difference in tax treatment. For high-tariff consumers in Maharashtra or Tamil Nadu paying ₹11–14/unit, both models deliver sub-4-year payback when tax benefits are applied.
When Industrial Facilities Use Both
The most sophisticated industrial energy strategies don’t choose between ground mounted and rooftop solar — they use both. A common configuration: rooftop covers 60–70% of the facility’s daytime load at the lowest cost per unit, while a ground mounted system covers the remaining demand and provides a buffer for load growth.
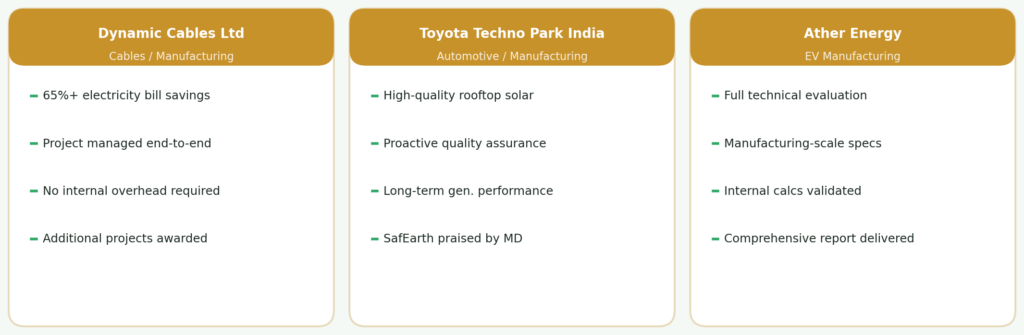
Ather Energy engaged SafEarth for a detailed technical evaluation of their manufacturing-scale solar requirements precisely because their load profile and site configuration required integrated thinking — not a single-model prescription. Atomberg’s CFO noted they needed a true end-to-end partner, not a consultant, for the same reason. For facilities where load exceeds both rooftop and available land capacity, open access solar and group captive models extend the solar supply chain beyond the facility boundary entirely.
The Decision Framework: How to Choose
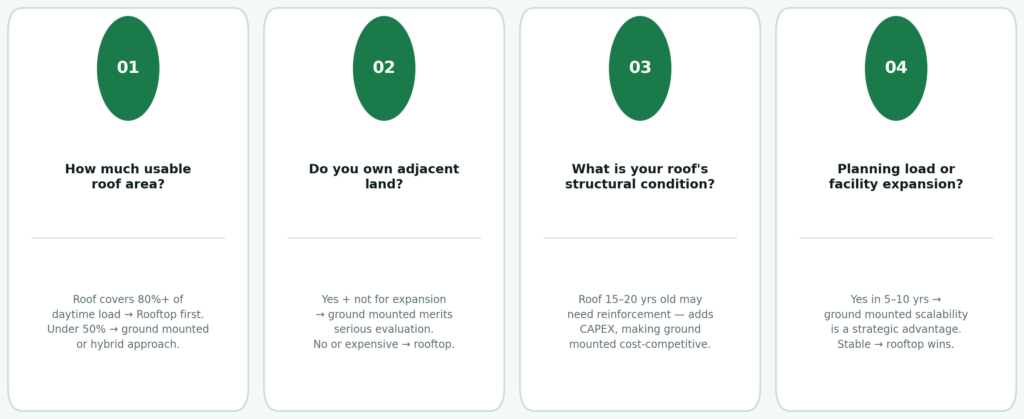
Dynamic Cables built their solar strategy around clear answers to each of these questions — and achieved 65%+ savings on electricity bills as a result, managed end-to-end by SafEarth with no internal overhead. See the full case library at SafEarth’s case studies.
FAQ: Ground Mounted vs Rooftop Solar for Industrial Facilities
Which Is Cheaper — Ground Mounted or Rooftop Solar for a Factory?
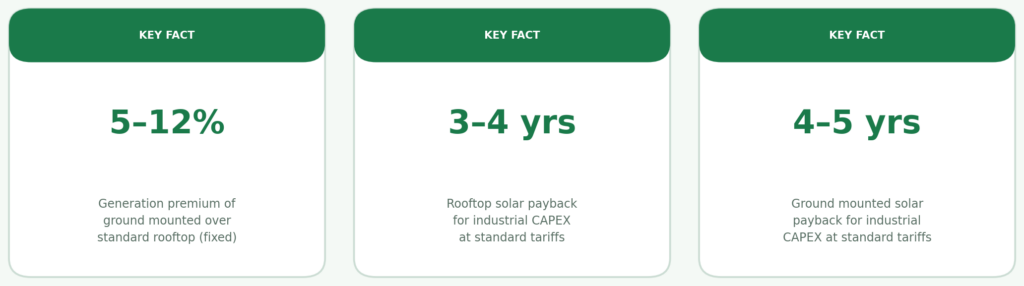
Rooftop solar carries lower installed CAPEX — typically ₹35,000–42,000/kW versus ₹38,000–48,000/kW for ground mounted, excluding land. Rooftop also delivers faster payback — 3–4 years versus 4–5 years at standard tariffs. However, ground mounted generates 5–12% more electricity per kW due to optimal tilt and better ventilation — partially offsetting the CAPEX difference over a 25-year horizon. Use SafEarth’s solar savings calculator to model both against your facility’s specifics.
Can an Industrial Facility Have Both Rooftop and Ground Mounted Solar?
Yes — and this is increasingly common for large industrial consumers. Rooftop covers base load at lowest cost, ground mounted covers additional demand or provides a generation buffer for load growth. Both integrate into a single energy accounting framework.
Does Ground Mounted Solar Produce More Electricity Than Rooftop?
Yes — typically 5–12% more per kW of installed capacity. Ground mounted panels can be fixed at optimal tilt angle (22–25° for most of India), benefit from better air circulation reducing panel temperature, and with single-axis tracking can reach a 15–25% generation premium over standard rooftop. For industrial buyers where maximising generation per rupee of CAPEX matters most over a 25-year horizon, ground mounted delivers a stronger long-term generation profile.
What Happens to a Ground Mounted System If the Factory Expands?
Ground mounted systems on owned land can be expanded by adding rows of panels. If land expansion is not possible, the additional load can be met through open access solar or group captive procurement. SafEarth structures DPRs with expansion scenarios modelled explicitly — so industrial buyers know their growth pathway before the first panel is installed.
Conclusion: The Right Answer Is Site-Specific
Ground mounted solar delivers superior generation performance and O&M convenience, at higher upfront cost and land requirement. Rooftop solar delivers faster payback and lower CAPEX, bounded by roof area and structural constraints.
For most industrial facilities in India, the right answer is: rooftop first, ground mounted where rooftop cannot scale. The facilities that are locked into a single model without analysis are the ones leaving generation — and savings — on the table.
Ready to unlock your solar advantage? Talk to our team of experts at SafEarth — and let’s build the system that works for your facility. Schedule a consultation at safearth.in/contact