
Your electricity bill isn’t a fixed cost. It’s a signal — that your manufacturing operations are carrying an avoidable expense that CFOs at India’s most competitive plants are already eliminating.
For manufacturing companies, energy is typically the second-largest operating cost after raw materials. Industrial electricity tariffs across India now range from ₹7 to ₹12 per unit, depending on the state — and according to CEEW research, grid rates are structurally rising as state regulators shift more fixed costs onto commercial and industrial consumers. That trajectory doesn’t reverse. It compounds.
Solar isn’t a green gesture. For manufacturing companies, it is one of the most direct levers available to structurally improve EBITDA — through lower operating costs, accelerated tax depreciation, and locked-in energy rates that decouple your margins from grid volatility.
This post breaks down exactly how solar improves EBITDA for manufacturing companies in India: the mechanics, the numbers, and the decisions that determine how much value you capture.
Why Manufacturing Companies Are Energy-Intensive by Design
India’s industry sector accounts for 42% of total national electricity consumption, with manufacturing plants representing the bulk of that draw. Process heating, compressed air systems, conveyor lines, cooling towers, lighting — these loads run across 12 to 24 hours a day, every day.
For a mid-sized manufacturing plant spending ₹30–50 lakh per month on electricity, that’s ₹3.6–6 crore annually flowing out of operating cash flow. Strip that number out of your EBITDA calculation and you begin to see the scale of the opportunity.
What EBITDA Actually Measures — and Why Energy Costs Matter
EBITDA — Earnings Before Interest, Taxes, Depreciation, and Amortisation — is the most direct measure of a company’s core operating performance. It strips away financing and accounting variables to reveal how efficiently a business converts revenue into profit.
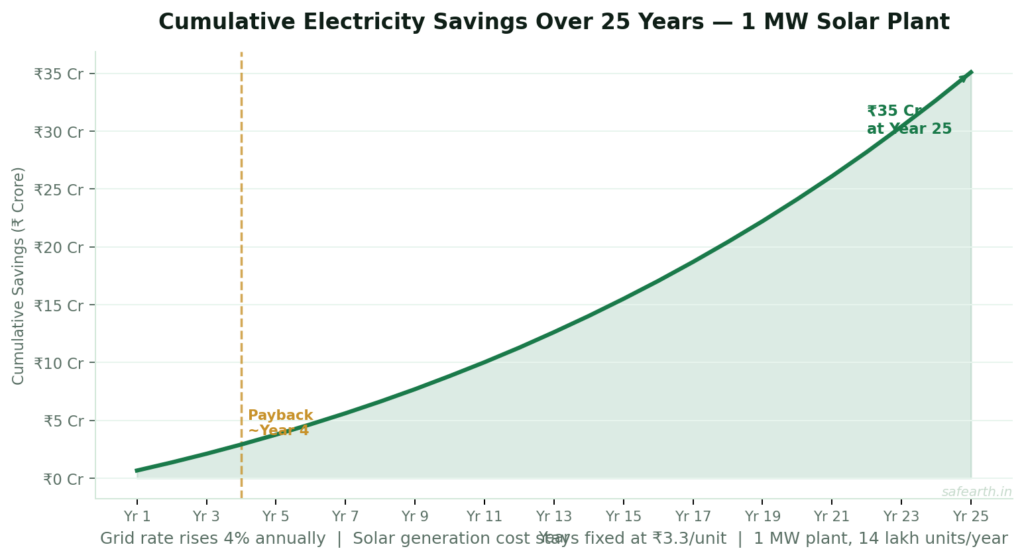
Electricity costs sit squarely inside EBITDA. They are operating expenses. Every rupee saved on power flows directly upward into operating earnings. There is no dilution, no leakage through financing costs. This is why solar improves EBITDA for manufacturing companies in a way that most other capital investments don’t: the savings are recurring, compounding, and structurally locked in for 25 years.
The Grid Tariff Problem Isn’t Going Away
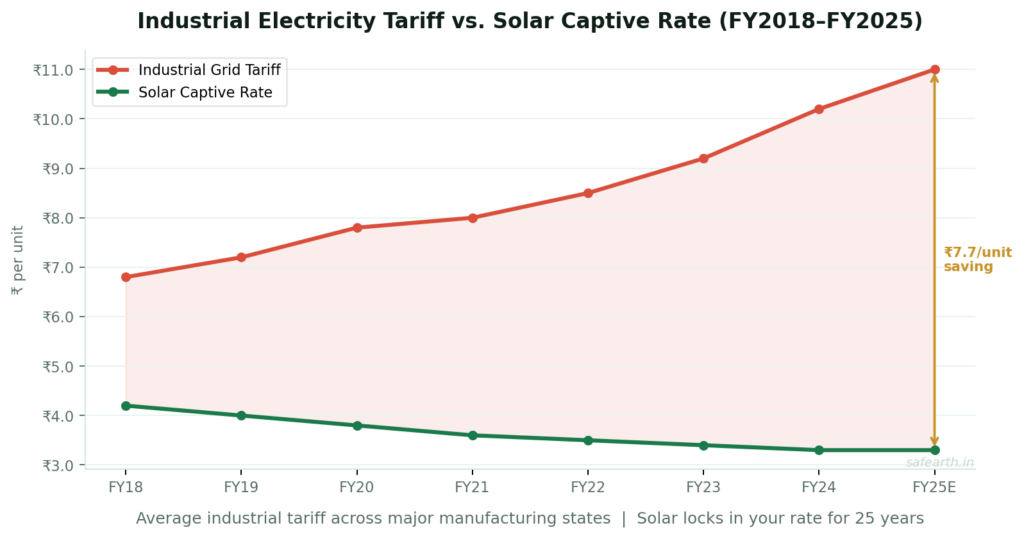
Between FY2022 and FY2024, industrial electricity rates in India moved between ₹10–11 per unit. Several state electricity regulatory commissions — including Karnataka, Maharashtra, and Rajasthan — are now shifting to higher fixed charges, making long-term energy cost prediction harder for plant operators.
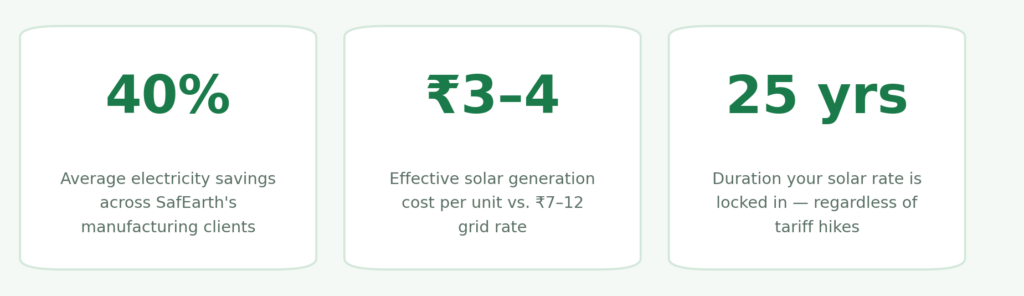
The answer isn’t to manage around rising rates. It’s to lock in a 25-year solar rate of ₹3–4 per unit before the grid keeps climbing.
How Solar Directly Improves EBITDA: The Four Mechanisms
Solar’s EBITDA impact on manufacturing companies operates through four distinct financial channels. Understanding each one allows your CFO to model the full impact — not just the headline electricity savings.
Captive solar plants convert a variable grid expense into a fixed, declining-cost infrastructure asset.
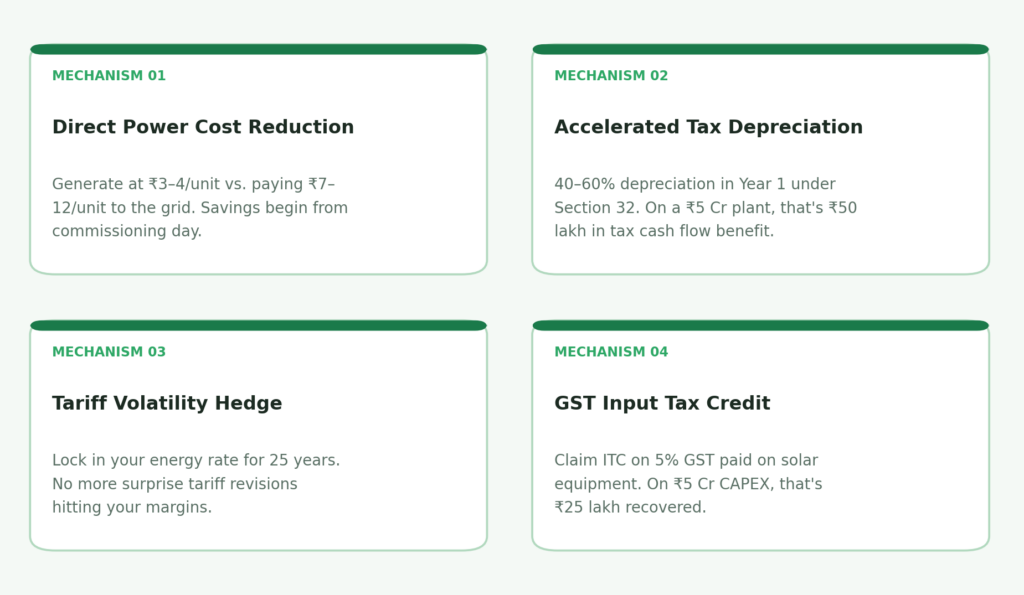
1. Direct Reduction in Power Purchase Costs
A rooftop or ground-mounted solar plant generates electricity at an effective cost of ₹3–4 per unit over its operational life — compared to grid rates of ₹7–12 per unit depending on your state and sanctioned load category.
Scale this to a 1 MW system and the annual EBITDA accretion exceeds ₹65–70 lakh. Across SafEarth’s client portfolio, manufacturing companies have achieved an average of 40% savings on electricity bills — a direct operating margin unlock that compounds annually as grid rates rise while solar rates remain fixed.
2. Accelerated Depreciation — The Tax Lever CFOs Often Underestimate
Under Section 32 of India’s Income Tax Act, solar power systems qualify for 40% accelerated depreciation in the first year of operation. If commissioned for more than 180 days within the financial year, an additional 20% can be claimed — bringing first-year depreciation to 60% of total asset cost.
CFO Insight
A manufacturing company investing ₹5 crore in solar can claim ₹2 crore in depreciation in Year 1 alone. At a 25% effective tax rate, that’s ₹50 lakh in cash flow benefit in the first year — before a single rupee of electricity savings is counted.
This depreciation does not directly show up in EBITDA (which sits above D&A), but it reduces tax liability in the years when capital expenditure is highest — improving post-tax returns and freeing cash flow for reinvestment. For CFOs evaluating the full financial case, the after-tax NPV picture is substantially stronger than the EBITDA line alone.
3. Reduced Exposure to Tariff Volatility
Every time electricity tariffs revise upward — which historically happens every 1–3 years across Indian states — manufacturing companies absorb that cost in real-time. Solar changes this. A captive installation converts a variable operating cost (grid electricity) into a fixed capital investment with a known return profile. Once installed, the cost per unit generated stays at ₹3–4 for 25 years.
For manufacturing companies working on thin operating margins of 8–15%, this predictability is strategic. It allows more accurate long-term pricing, better margin visibility, and more confident capacity expansion planning.
4. GST Credit Recovery on Solar CAPEX
Solar power systems attract 5% GST on panels, modules, and associated equipment. For a ₹5 crore installation, that’s ₹25 lakh in GST — which manufacturing companies registered under GST can claim as input tax credit. This reduces effective project cost, improves post-tax payback, and accelerates the point at which the investment becomes net EBITDA-additive.
How Much Does Solar Actually Move the EBITDA Needle?
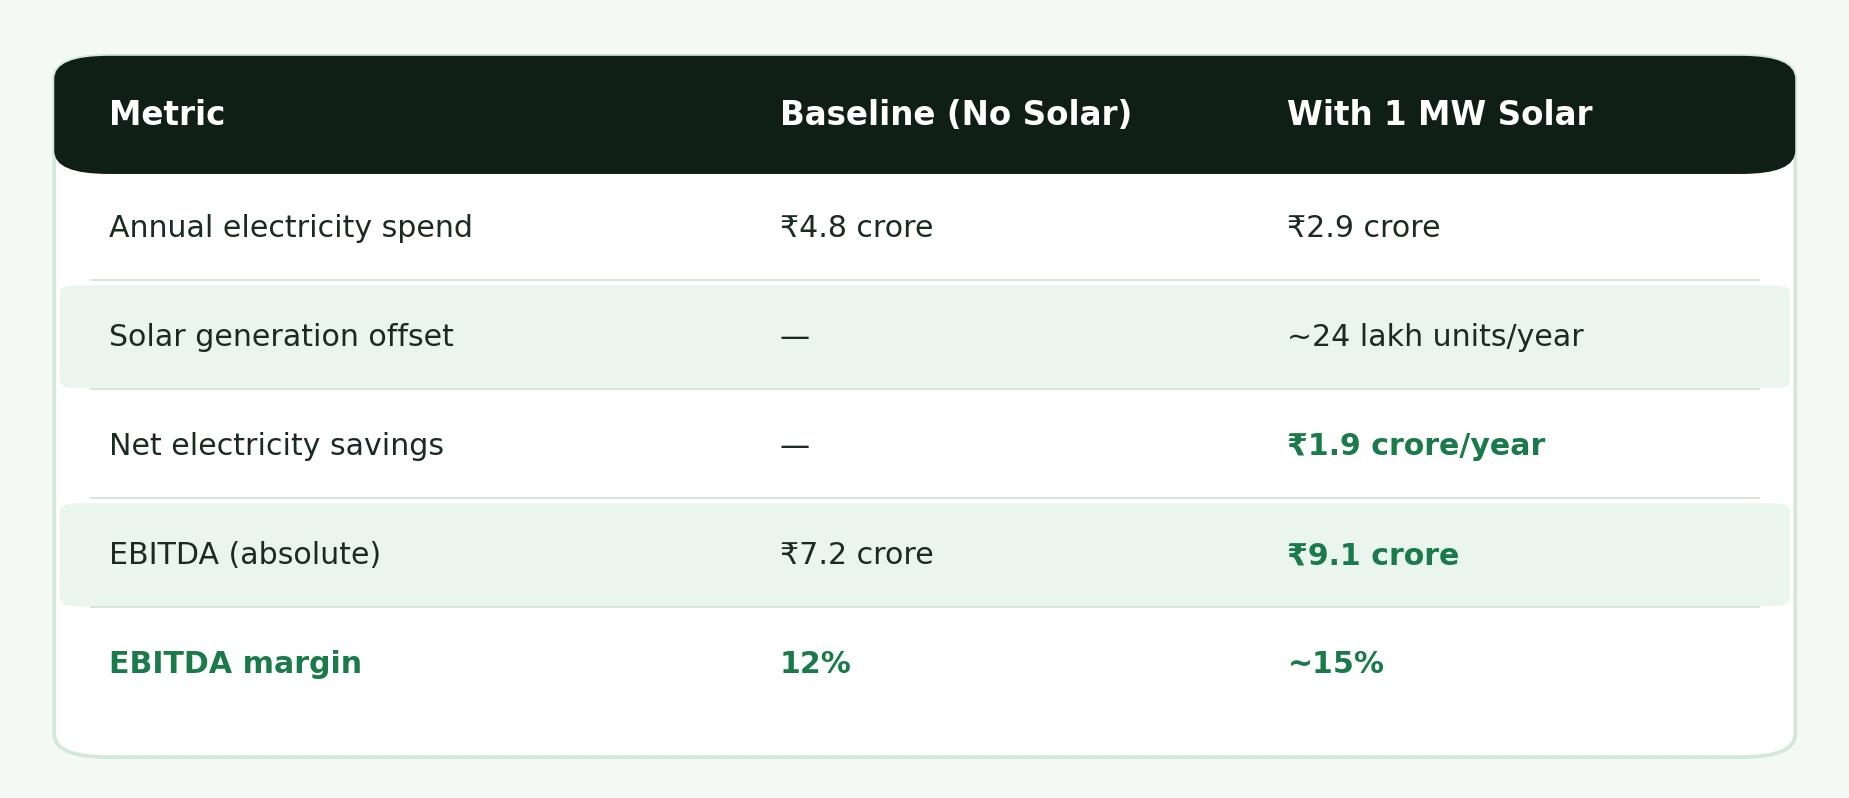
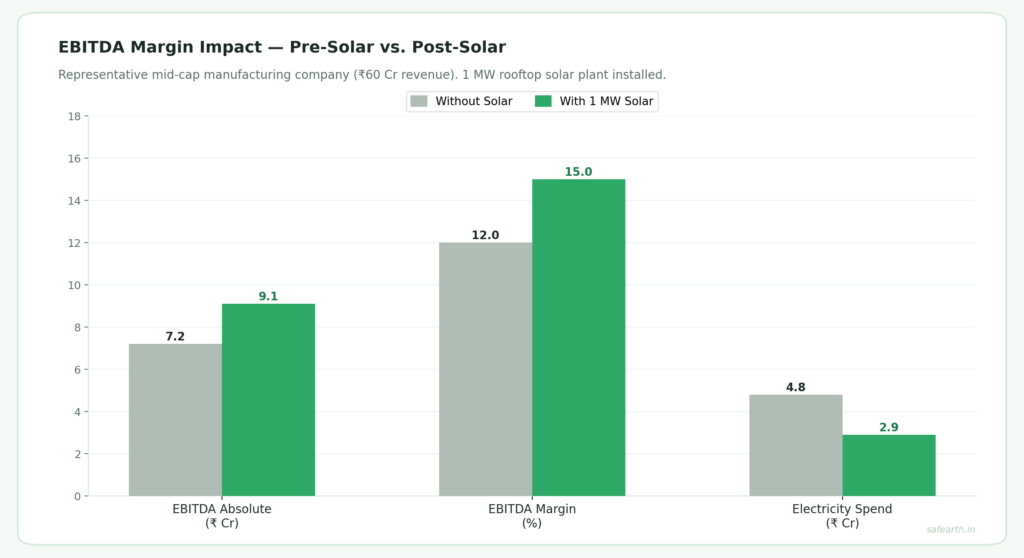
To model the full EBITDA improvement from solar, consider a representative mid-sized manufacturing plant with ₹60 crore in revenue and a 12% pre-solar EBITDA margin:
What Is the ROI on Industrial Solar for a Manufacturing Company in India?
The return on a solar investment for a manufacturing company depends on four variables: installed capacity, system cost, grid rate avoided, and financing model chosen.
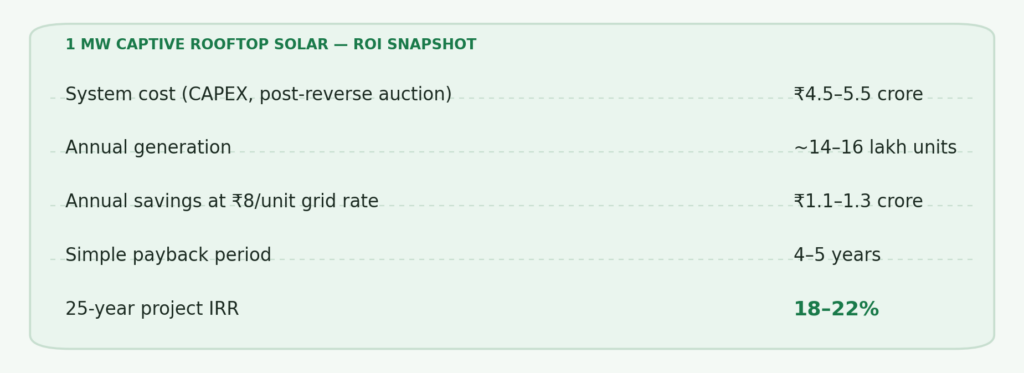
When accelerated depreciation benefits and GST credits are layered in, the effective payback period compresses to 3–4 years. You can explore detailed numbers using SafEarth’s profitability energy calculator to model your specific facility’s return profile.
For manufacturing companies evaluating financing options, the choice between CAPEX and PPA solar models also shapes the EBITDA impact. CAPEX ownership maximises long-term savings and tax benefits; PPA structures shift CAPEX off the balance sheet while still delivering 20–35% electricity cost reduction from Day 1.
Which Solar Models Work Best for Manufacturing Plants?
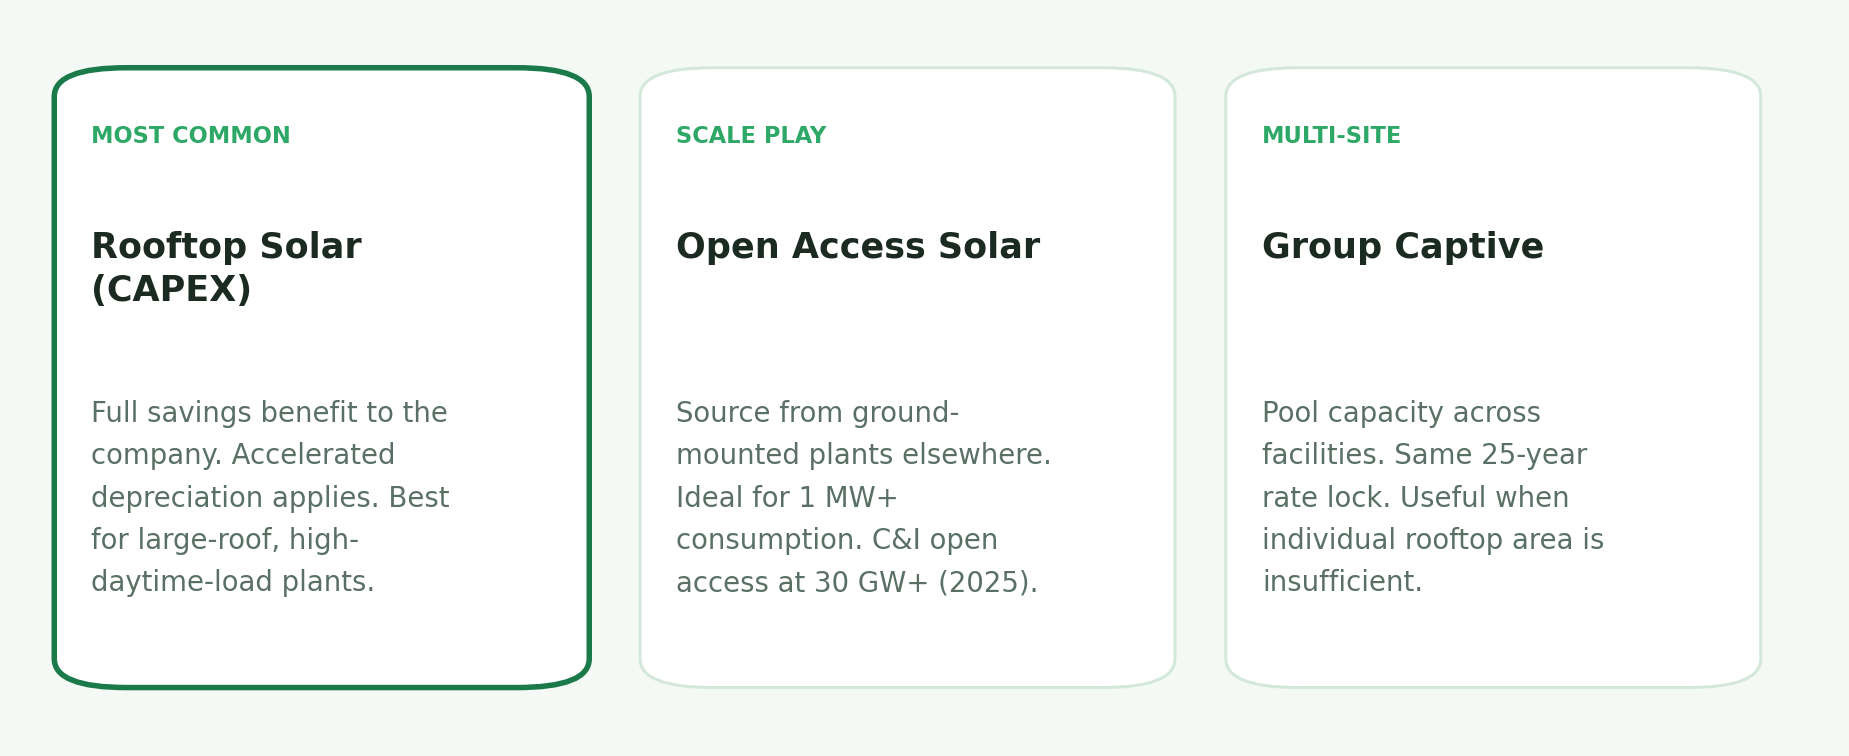
The right model depends on your load profile, rooftop area, state policy, and balance sheet structure. A properly structured DPR — which SafEarth delivers in 48 hours — maps all three options against your specific operating parameters before you commit. Explore open access solar and group captive models in detail.
Does Solar Affect Valuation — Beyond EBITDA?
Yes. And this is a dimension that CFOs in growth-phase manufacturing companies are beginning to model more explicitly.
EBITDA is the primary input for enterprise value in most manufacturing company valuations (EV/EBITDA multiples of 8–12x are common in Indian mid-cap manufacturing). A ₹1.5–2 crore annual EBITDA improvement from solar, sustained over 25 years, doesn’t just improve annual profitability — it increases the terminal value of the business at the point of a capital raise, PE investment, or sale.
Valuation Multiplier Effect
At an 8× EV/EBITDA multiple, a ₹1.9 crore improvement in annual EBITDA from solar translates to a ₹15.2 crore increase in enterprise value on paper — from a ₹5 crore capital investment.
Beyond multiples, manufacturing companies with credible energy cost structures and documented outcomes are increasingly receiving preference in procurement decisions from multinational OEMs and export customers navigating Scope 3 emissions requirements. Solar improves EBITDA. It also improves the story — and the story now has commercial value in its own right.
FAQ: Solar and EBITDA for Manufacturing Companies
How quickly does solar start improving EBITDA after installation?
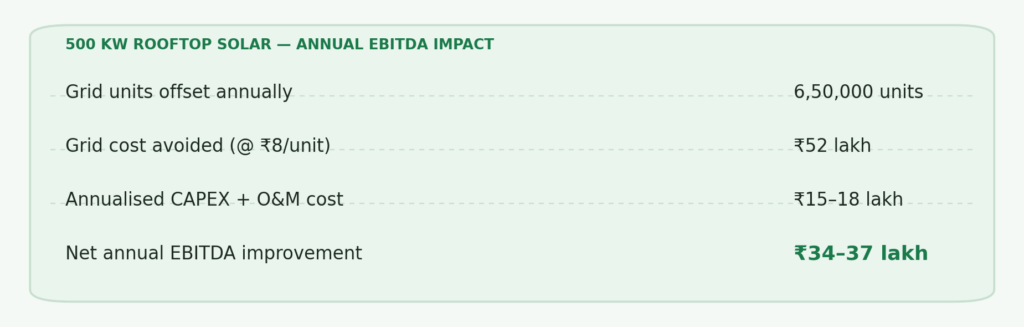
Savings begin from the first full billing cycle after commissioning — typically within 30–45 days of the system going live. There is no ramp-up period. A 500 kW system producing 55,000–60,000 units per month at ₹8/unit delivers ₹4.4–4.8 lakh in monthly savings from month one. Year one EBITDA improvement is visible in the first quarterly review post-commissioning.
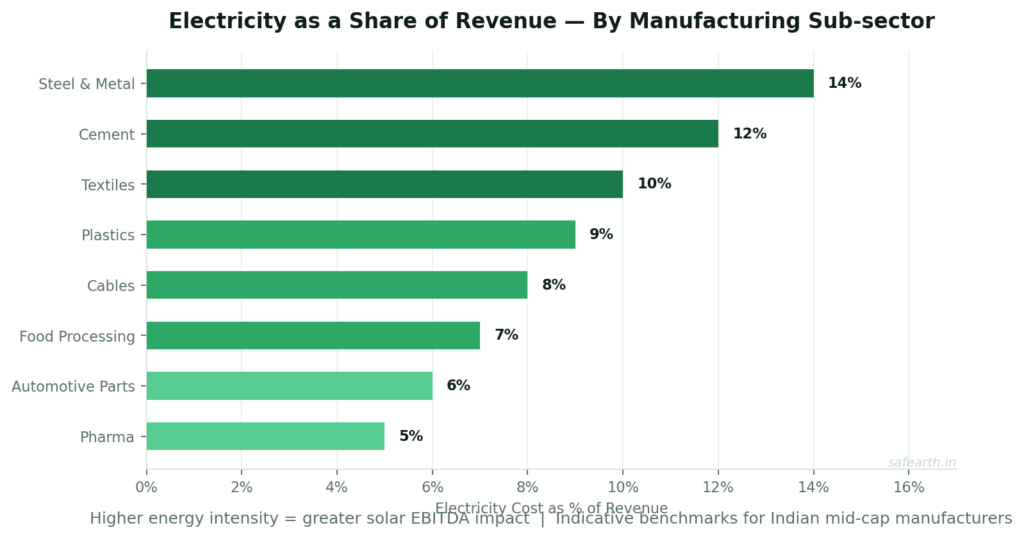
Is solar EBITDA impact different for energy-intensive manufacturing sub-sectors?
Yes. The improvement scales with energy intensity. For industries like plastics, cables, food processing, textiles, and automotive components — where electricity forms 5–12% of total revenue — the EBITDA impact of a well-sized solar plant can be 2–4 percentage points. Ather Energy engaged SafEarth to produce a detailed technical evaluation of their manufacturing-scale solar requirements, precisely to understand this tailored impact before committing.
Can a manufacturing company use both rooftop solar and open access together?
Yes. Hybrid configurations are increasingly common for large manufacturers with multiple facilities. Rooftop solar handles base load at the lowest possible cost; open access supplements during peak consumption periods or covers excess load. SafEarth’s industrial solar advisory includes portfolio-level modelling for companies that want to optimise across both channels.
What is the minimum consumption level that makes solar financially viable for a manufacturing plant?
Manufacturing facilities spending ₹5 lakh or more per month on electricity will find solar financially viable with payback periods of 4–6 years. For plants spending ₹20–50 lakh per month, solar isn’t just viable — it is one of the highest-returning capital investments on the balance sheet. Explore your numbers on SafEarth’s industrial solar ROI calculator.
Does solar require significant operational involvement from plant management?
Not with the right partner. SafEarth’s construction management uses a SaaS platform that provides real-time project tracking, quality oversight, and regulatory sign-offs — without adding workload to plant management teams. Post-commissioning, predictive maintenance and solar O&M services ensure performance is monitored continuously. As Atomberg’s CFO noted, the need was for a true end-to-end partner — and SafEarth delivered integrated expertise across procurement, construction, and operations.