

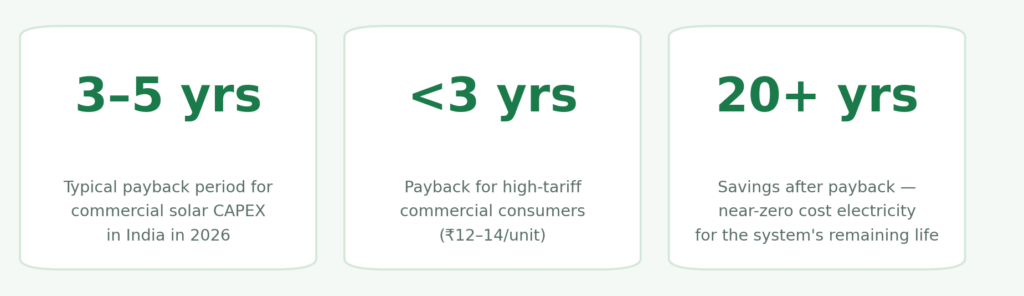
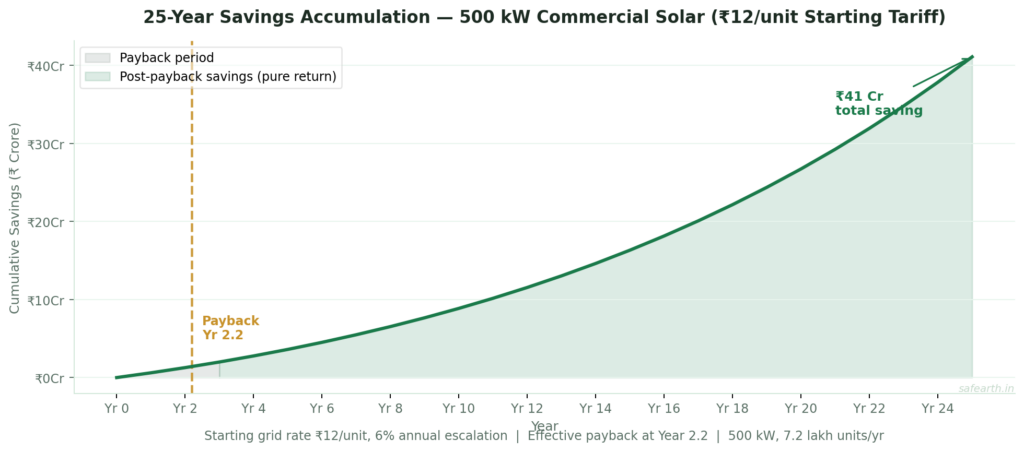
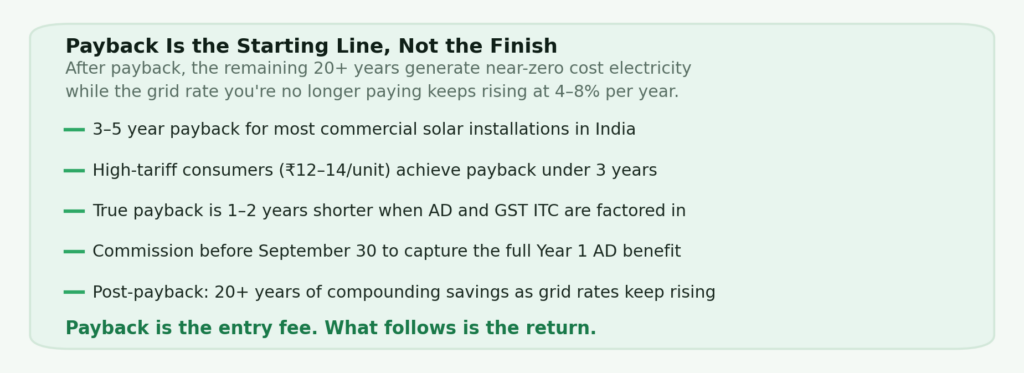
It’s the right question. And in India in 2026, the answer is better than most businesses expect. For rooftop CAPEX installations, the payback period for commercial solar in India typically lands between 3 and 4 years — and for high-tariff commercial consumers, it can be as short as 2.5 years. After that, every unit your system generates is money you keep instead of paying the grid.
But the range is real. A 100 kW rooftop on a Maharashtra commercial complex paying ₹14/unit clears payback in under 3 years. A similar system in a state with ₹7/unit industrial tariffs may take 5–6 years. Understanding what drives payback is what separates businesses that get the outcome they modelled from those that get a surprise.
What Is the Solar Payback Period — and How Is It Calculated?
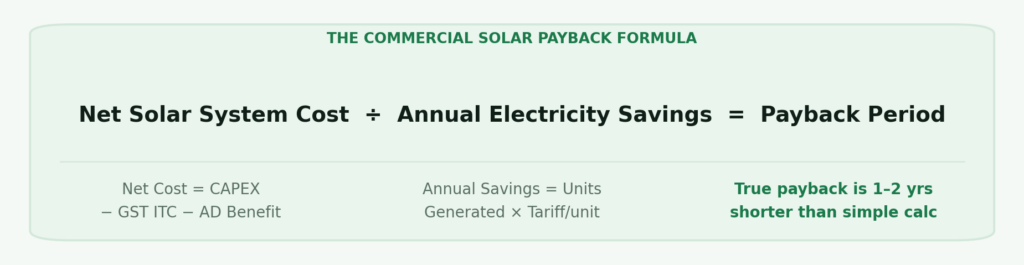
The payback period is the time it takes for your cumulative electricity savings to equal the upfront cost of your solar installation. It is the simplest financial metric in solar, and the most widely used for initial evaluation.
Simple Payback vs. True Payback
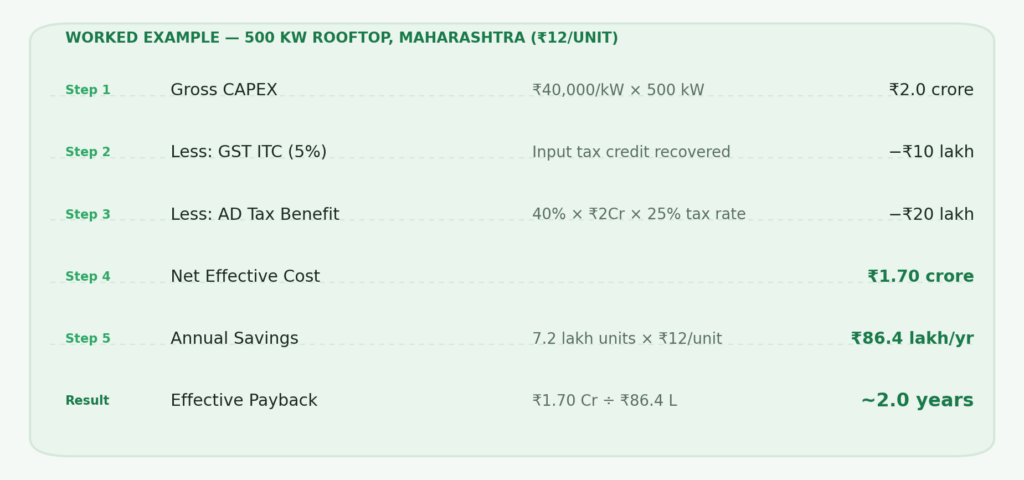
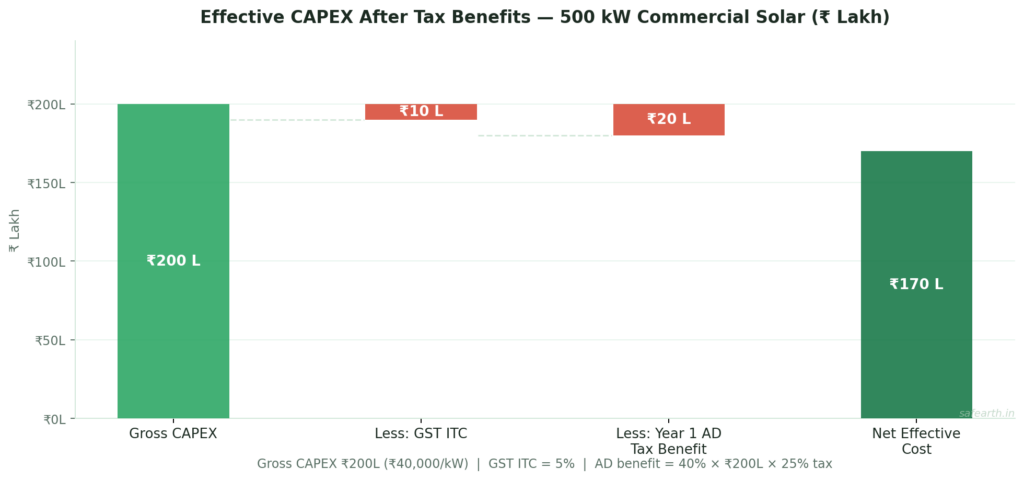
There is an important distinction most evaluations miss. Simple payback uses raw CAPEX divided by annual savings. True payback for commercial solar buyers in India also accounts for 40% accelerated depreciation under Section 32 of the Income Tax Act — on a ₹1 crore system at a 25% tax rate, that’s ₹10 lakh in tax benefit in Year 1 alone — plus 5% GST input tax credit recovery and the compounding effect of tariff escalation widening annual savings every year.
For a typical commercial solar installation, the payback period can reduce from 5–6 years to 3–4 years when tax incentives are effectively utilised. True payback is consistently 1–2 years shorter than the simple calculation suggests.
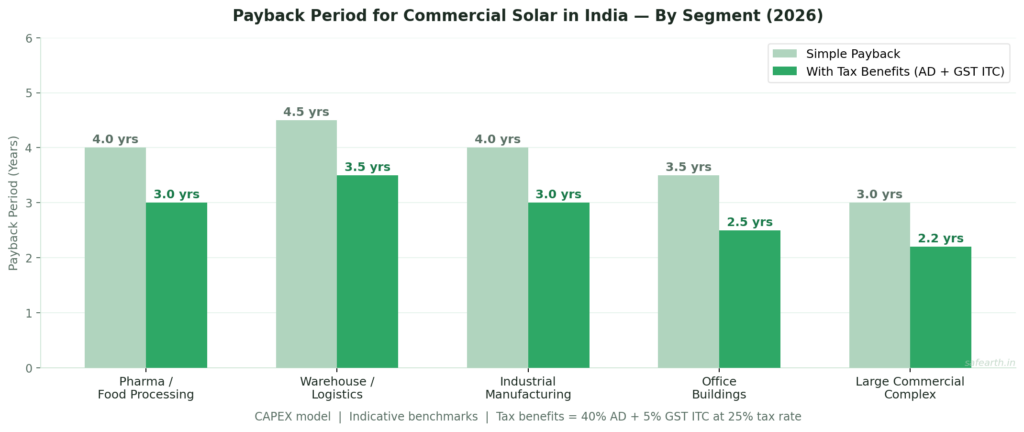
Payback Period Benchmarks for Commercial Solar in India
C&I rooftop solar systems typically offer 15–20% ROI with a 3–5 year payback period, followed by 20+ years of savings. But that range hides significant variation by sector and tariff.
A 100 kW solar plant costing approximately ₹45–50 lakh can save ₹12–15 lakh annually in electricity costs at ₹10–12/unit tariffs. That means a payback period of around 3 years — after which nearly two decades of free electricity follow.
Pioneer Hygiene achieved 40% savings on electricity bills - guided end to end by SafEarth with zero prior solar knowledge. Dynamic Cables cut bills over 65% and avoided 1,710 tonnes of CO2 annually - without managing a single aspect of the project themselves.
The Four Variables That Determine Your Actual Payback Period
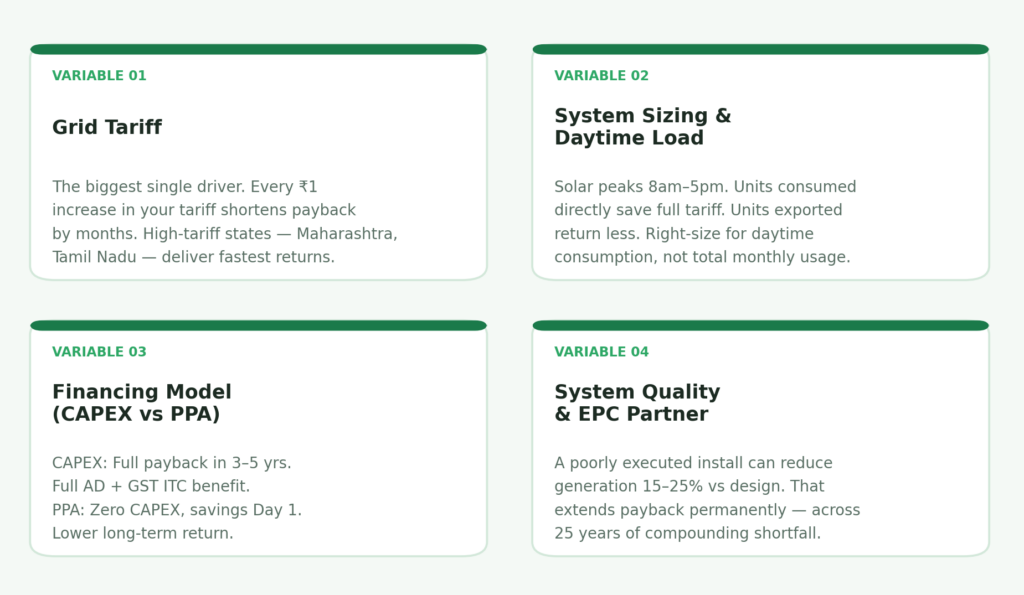
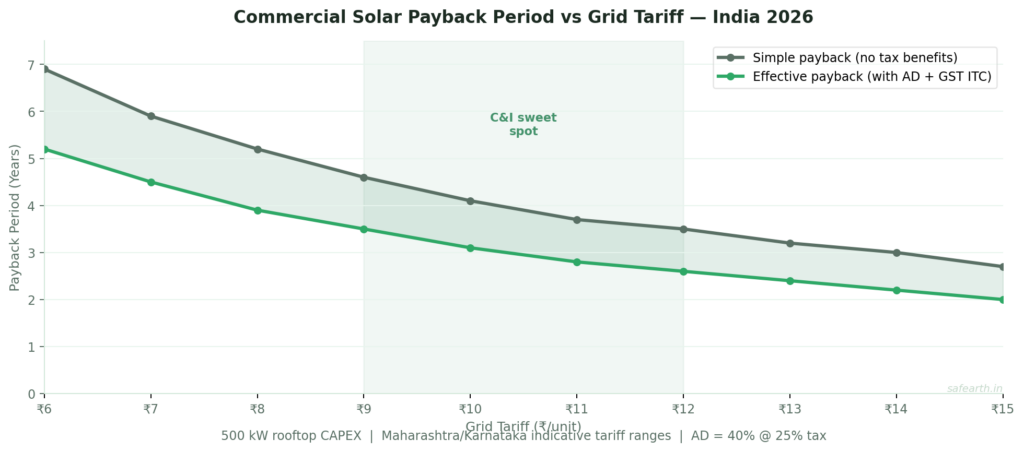
1. Your Grid Tariff: The Biggest Single Driver
State-wise DISCOM rates vary substantially. Maharashtra’s MERC-approved tariffs for FY 2025-26 show HT Industry tariffs at ₹8.68/kVAh and commercial tariffs at ₹14.03/kVAh. Commercial consumers paying tariffs of ₹15–20/kWh can recover rooftop solar investments in as few as 12 to 18 months. Every ₹1 increase in your grid tariff shortens payback by months.
2. System Sizing and Daytime Load Match
Solar generates between 8am and 5pm. Every unit generated during those hours that you consume directly avoids a grid purchase at full tariff — maximising savings. The optimal commercial solar system is sized to match your peak daytime consumption — not your total monthly consumption. Over-sizing reduces effective payback; under-sizing leaves savings on the table.
3. CAPEX vs PPA: How You Finance It
CAPEX: Full payback in 3–5 years. Accelerated depreciation and GST ITC apply. Highest long-term return. PPA / RESCO: Zero CAPEX — savings begin Day 1 with no payback period to recover. Lower long-term return as the developer retains depreciation benefits. Solar loan / financing: Monthly EMI is often lower than current electricity savings — making the system cash-flow positive from Month 1.
4. System Quality and Long-Term Performance
A poorly executed installation can reduce actual generation by 15–25% versus design expectations — extending payback permanently. The selection of your EPC partner and the quality of the DPR before installation determines whether your payback matches your model. Lamtuf Plastics used SafEarth specifically to navigate competing vendor quotes — choosing the optimal EPC partner based on bid analysis rather than the lowest quote, protecting long-term generation performance. Learn how to evaluate partners with SafEarth’s solar EPC selection guide
How to Calculate Your Commercial Solar Payback Period
Use SafEarth’s commercial solar profitability calculator to model your specific numbers with state-level tariff data built in.
What Shortens the Payback Period for Commercial Solar in India
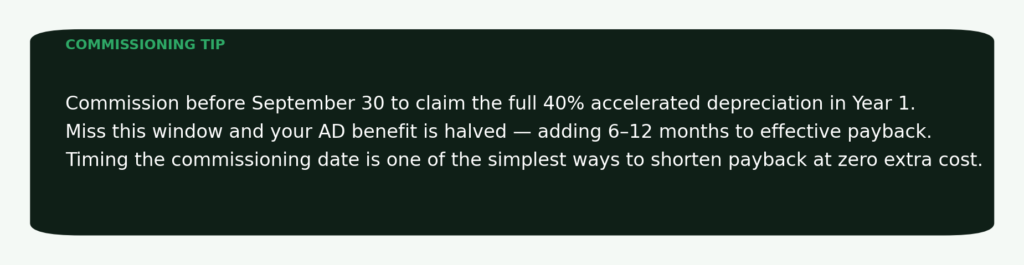
Beyond commissioning timing, two other levers work at the planning stage. First, choose captive over third-party open access when rooftop area is sufficient — captive CAPEX captures the full grid-vs-solar spread without cross-subsidy surcharge. Second, use reverse auction procurement — SafEarth’s reverse auction model saves an average of 10% on CAPEX, directly compressing the payback numerator without touching annual savings. For scale needs beyond rooftop, open access solar options are structured to minimise surcharge exposure.
FAQ: Payback Period for Commercial Solar in India
What Is the Average Payback Period for Commercial Solar in India in 2026?
For CAPEX rooftop installations, the payback period for commercial solar in India typically ranges from 3 to 5 years, with high-tariff commercial consumers (₹12–14/unit) often achieving payback in under 3 years. When accelerated depreciation and GST credit are factored in, effective payback is consistently 1–2 years shorter than the simple calculation. After payback, the system continues generating savings — at near-zero cost — for the remaining 20+ years of its operational life.
Does the Payback Period Differ for Manufacturing vs Commercial Office Buildings?
Yes — primarily because of tariff differences. Manufacturing facilities on HT industrial tariffs of ₹8–10/unit see payback of 3.5–5 years. Commercial office buildings on LT commercial tariffs of ₹10–14/unit often achieve payback in 2.5–3.5 years. The solar system costs are similar; the savings rate is higher for higher-tariff consumers. Explore solar for manufacturing plants and commercial rooftop solar options with their respective benchmarks.
Can a PPA Model Reduce the Payback Period for Commercial Solar?
The PPA model eliminates payback entirely in the traditional sense — since there’s no capital outlay, there’s no period to recover. Savings begin Day 1 as a fixed reduction versus your grid tariff. The trade-off is that long-term returns are lower — the developer captures the depreciation benefit and asset value. For businesses prioritising cash flow preservation, PPA delivers immediate savings with no upfront exposure. Read more about solar PPA structures for Indian businesses.
Does a 1 MW Solar Plant Have a Different Payback Than a 100 kW System?
Yes — larger systems benefit from economies of scale. The per-kW installation cost for a 1 MW system is typically 10–15% lower than a 100 kW system. Combined with SafEarth’s reverse auction procurement model, 1 MW solar plant projects often achieve payback 6–12 months faster than smaller installations on a like-for-like tariff basis.
Calculate your exact commercial solar payback period in 48 hours with a free consultation and detailed project report modelled to your tariff load profile and roof area.